 This month’s pick highlights a software development package, Graphical Programming Interface or GPI. The lead developer, Nick Zwart, and senior author and current ISMRM president, Jim Pipe, discuss the design of GPI, its functionality, and their future development goals. They also shared several nice pictures, including a selfie.
MRMH: Can you give a brief summary of GPI?
Nick: GPI creates a graphical flow chart of a complex algorithm. What that means is you can interact with algorithm processing at different stages of your data pipeline. As you make changes to certain areas, those updates will be managed by GPI and processed in a timely manner. That allows you to rapidly prototype new algorithms by reconfiguring the different nodes you’ve recreated, almost like a puzzle. A lot of people have said it feels like a video game.
Jim: We use it for a ton of stuff. If you want to post-process images, or set up something for a physician who’s not a programmer, you can set it up so it’s very easy for them to read in files and draw an ROI, and they can get the answer they want. We also use it for education, because all the data gets processed visually. If you want to brainstorm an idea, having these visual blocks and putting them all together is really nice.
MRMH: Who is your target audience and are you doing anything to reach out to them?
Nick: Our target audience is really ourselves.
MRMH: That is very in-house.
Nick: Every lab develops their own software, and we’re no different in that respect. We are trying to be very efficient at getting our research publicized and finishing it.
Jim: Outside the lab, we started by sharing with the Barrow Institute, and the Philips community. And we recently opened this up to the ISMRM and the wider MR community. From our point of view the way you can visualize data doesn’t have to be restricted to MR even. There are different levels.
Nick: We’ve also done classes. These courses were to teach Phillips folks who are interested in engaging in the Philips development tools for MR research.
MRMH: Classes you hosted were for Philips users and GPI is sponsored by Philips. Are you also trying to expand across platform?
Nick: We are open source. The project is hosted on GitHub, and that’s linked from the website. There is nothing specific about this reconstruction pipeline to MR actually and that should give some indication that it is certainly not specific to the Philips platform. As long as you can get your data into it, you can start processing the data. We do support many different scientific file formats and we are definitely open to collaboration. In terms of our own development we are interested in streamlining our own lab efficiency.
MRMH: Have you noticed increases in lab efficiency since you started using GPI?
Nick: [laughs] I’m really good at working with GPI.
Jim: We’ve always used this kind of thing and I do feel like it makes us really efficient, because of code sharing. Nick has a really cool diagram in which each GPI node get assigned the face of its primary developer, and from it you can see that we all use each others work and there is continuity there. So I don’t know what metric of efficiency you could use there, but clearly the work doesn’t get duplicated. I think that’s really good.
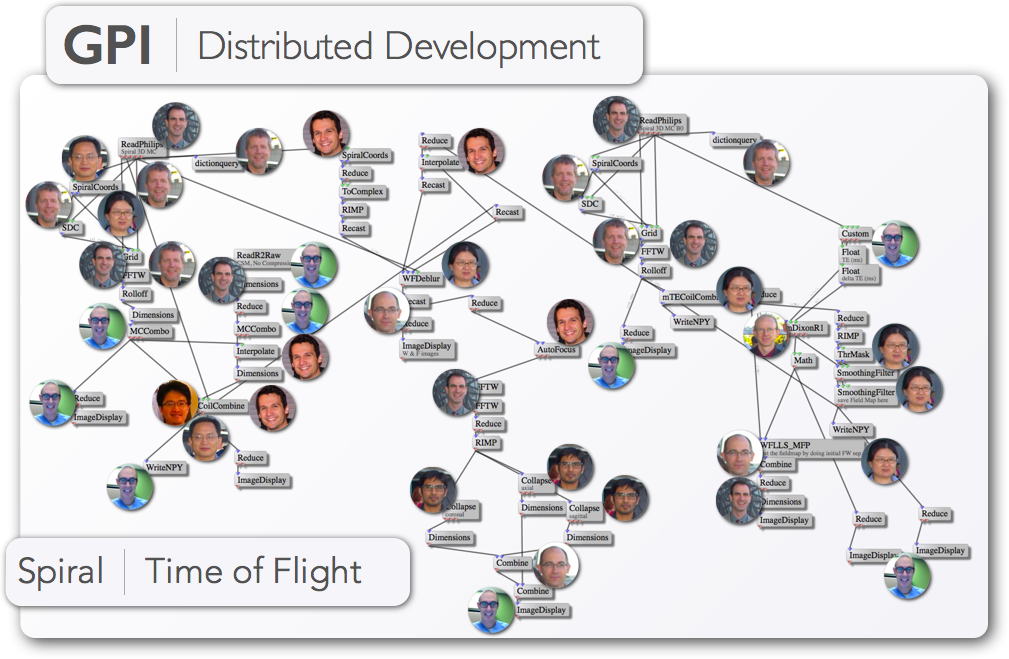
Putting faces to nodes.
MRMH: How big is the developer team and how easy is it to join?
Nick: I’ll break it down by software components. The framework is developed by two to three people. And the framework is what glues the node code together. It’s the canvas that you place nodes on. The node code extends the functionality. I think we probably have about 15 developers.
Jim: And the website gets about 300 hits a month now. We know it’s downloaded, but it’s unknown how many developers there actually are now that it’s open to everyone.
MRMH: What would be your ultimate vision for GPI?
Nick: I think because we’re working on MR reconstructions, it would be nice if this ran on the scanner. And if you could run your reconstructions on the fly, to at least be able to probe the data and see what’s coming off the scanner, that might help with pulse sequence design. I also see it as a teaching tool. I don’t think those are ultimate visions, though. Ultimately, Google says, “Hey, we want this!”
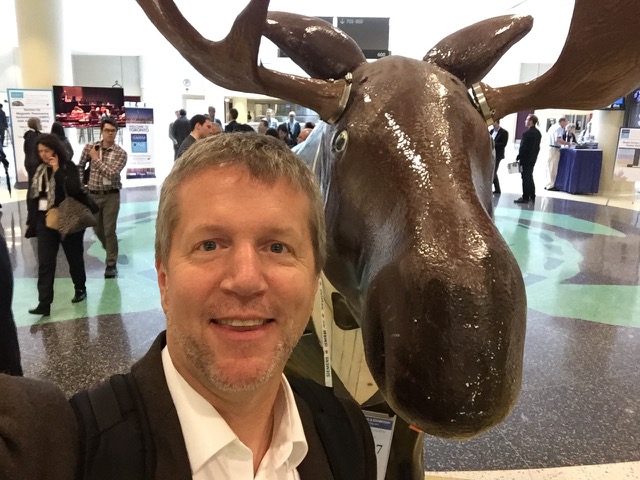
Jim with moose at 2015 ISMRM meeting in Toronto.
Jim: From my perspective, using GPI I think is intuitive. When we’re developing algorithms, I think we’re learning what is going on. If you can see what happens, if you have some kind of an algorithm, you can look at data at different parts, that is education. In my mind, that’s really a big part of why GPI is so nice. The educational part of it ties really nicely to development.
MRMH: And you can also see where things break, and learn from that?
Jim: Yea, we get a lot of experience there.
MRMH: Nick, what is your plan for the future? Do you plan to stay in academia?
Nick: One of the things that is cool about this lab is we are in a hybrid space. We’re part academia, and we are part of a healthcare system, but we’re also able to function in a sort of industrial capacity. My plans are pretty much to stay in this space as long as possible.
MRMH: Any final comments?
Jim: Nick has created a really excellent tool! I think many people will find it helpful, and hopefully a few will contribute to the project.
*Interview conducted by Erika Raven and Nikola Stikov.