Yu Liu1, Jun Chen Li1,2, Yongsheng Chen3, Naying He1, Zhijia Jin1, Weibo Chen4, Fuhua Yan1, and Ewart Mark Haacke1,5,6
1Radiology, Ruijin Hospital, Shanghai Jiao Tong University School of Medicine, Shanghai, China, 2Radiology, Changshu Hospital Affiliated to Nanjing University of Chinese Medicine, Changshu, China, 3Neurology, Wayne State University, Detroit, MI, United States, 4Philips Healthcare, Shanghai, China, 5Radiology, Wayne State University, Detroit, MI, United States, 6Biomedical Engineering, Wayne State University, Detroit, MI, United States
1Radiology, Ruijin Hospital, Shanghai Jiao Tong University School of Medicine, Shanghai, China, 2Radiology, Changshu Hospital Affiliated to Nanjing University of Chinese Medicine, Changshu, China, 3Neurology, Wayne State University, Detroit, MI, United States, 4Philips Healthcare, Shanghai, China, 5Radiology, Wayne State University, Detroit, MI, United States, 6Biomedical Engineering, Wayne State University, Detroit, MI, United States
We found that a magnetization transfer contrast (MTC) short echo scan, with a flip angle of 25-30o and a resolution of 0.67 x 0.67 x 1.34mm3 provides the best visualization of the LC.
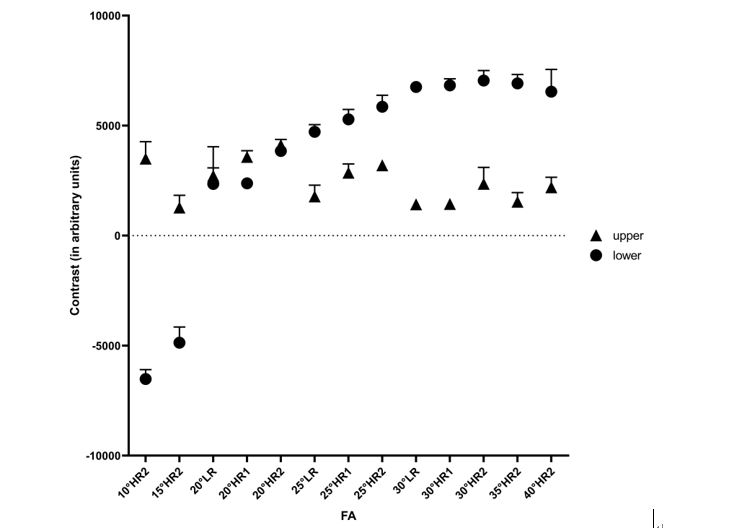
Figure 2. The plot is shown for one slice that visualizes the
LC clearly. When we choose the upper region as reference, the contrast peaks at 25o with a resolution of 0.67×0.67×1.34mm3.
As for the lower region, the peak occurs at 30owith the same resolution. LR (0.67×1.34×2mm3);HR1 (0.67×0.67×2mm3); and HR2 (0.67×0.67×1.34mm3).
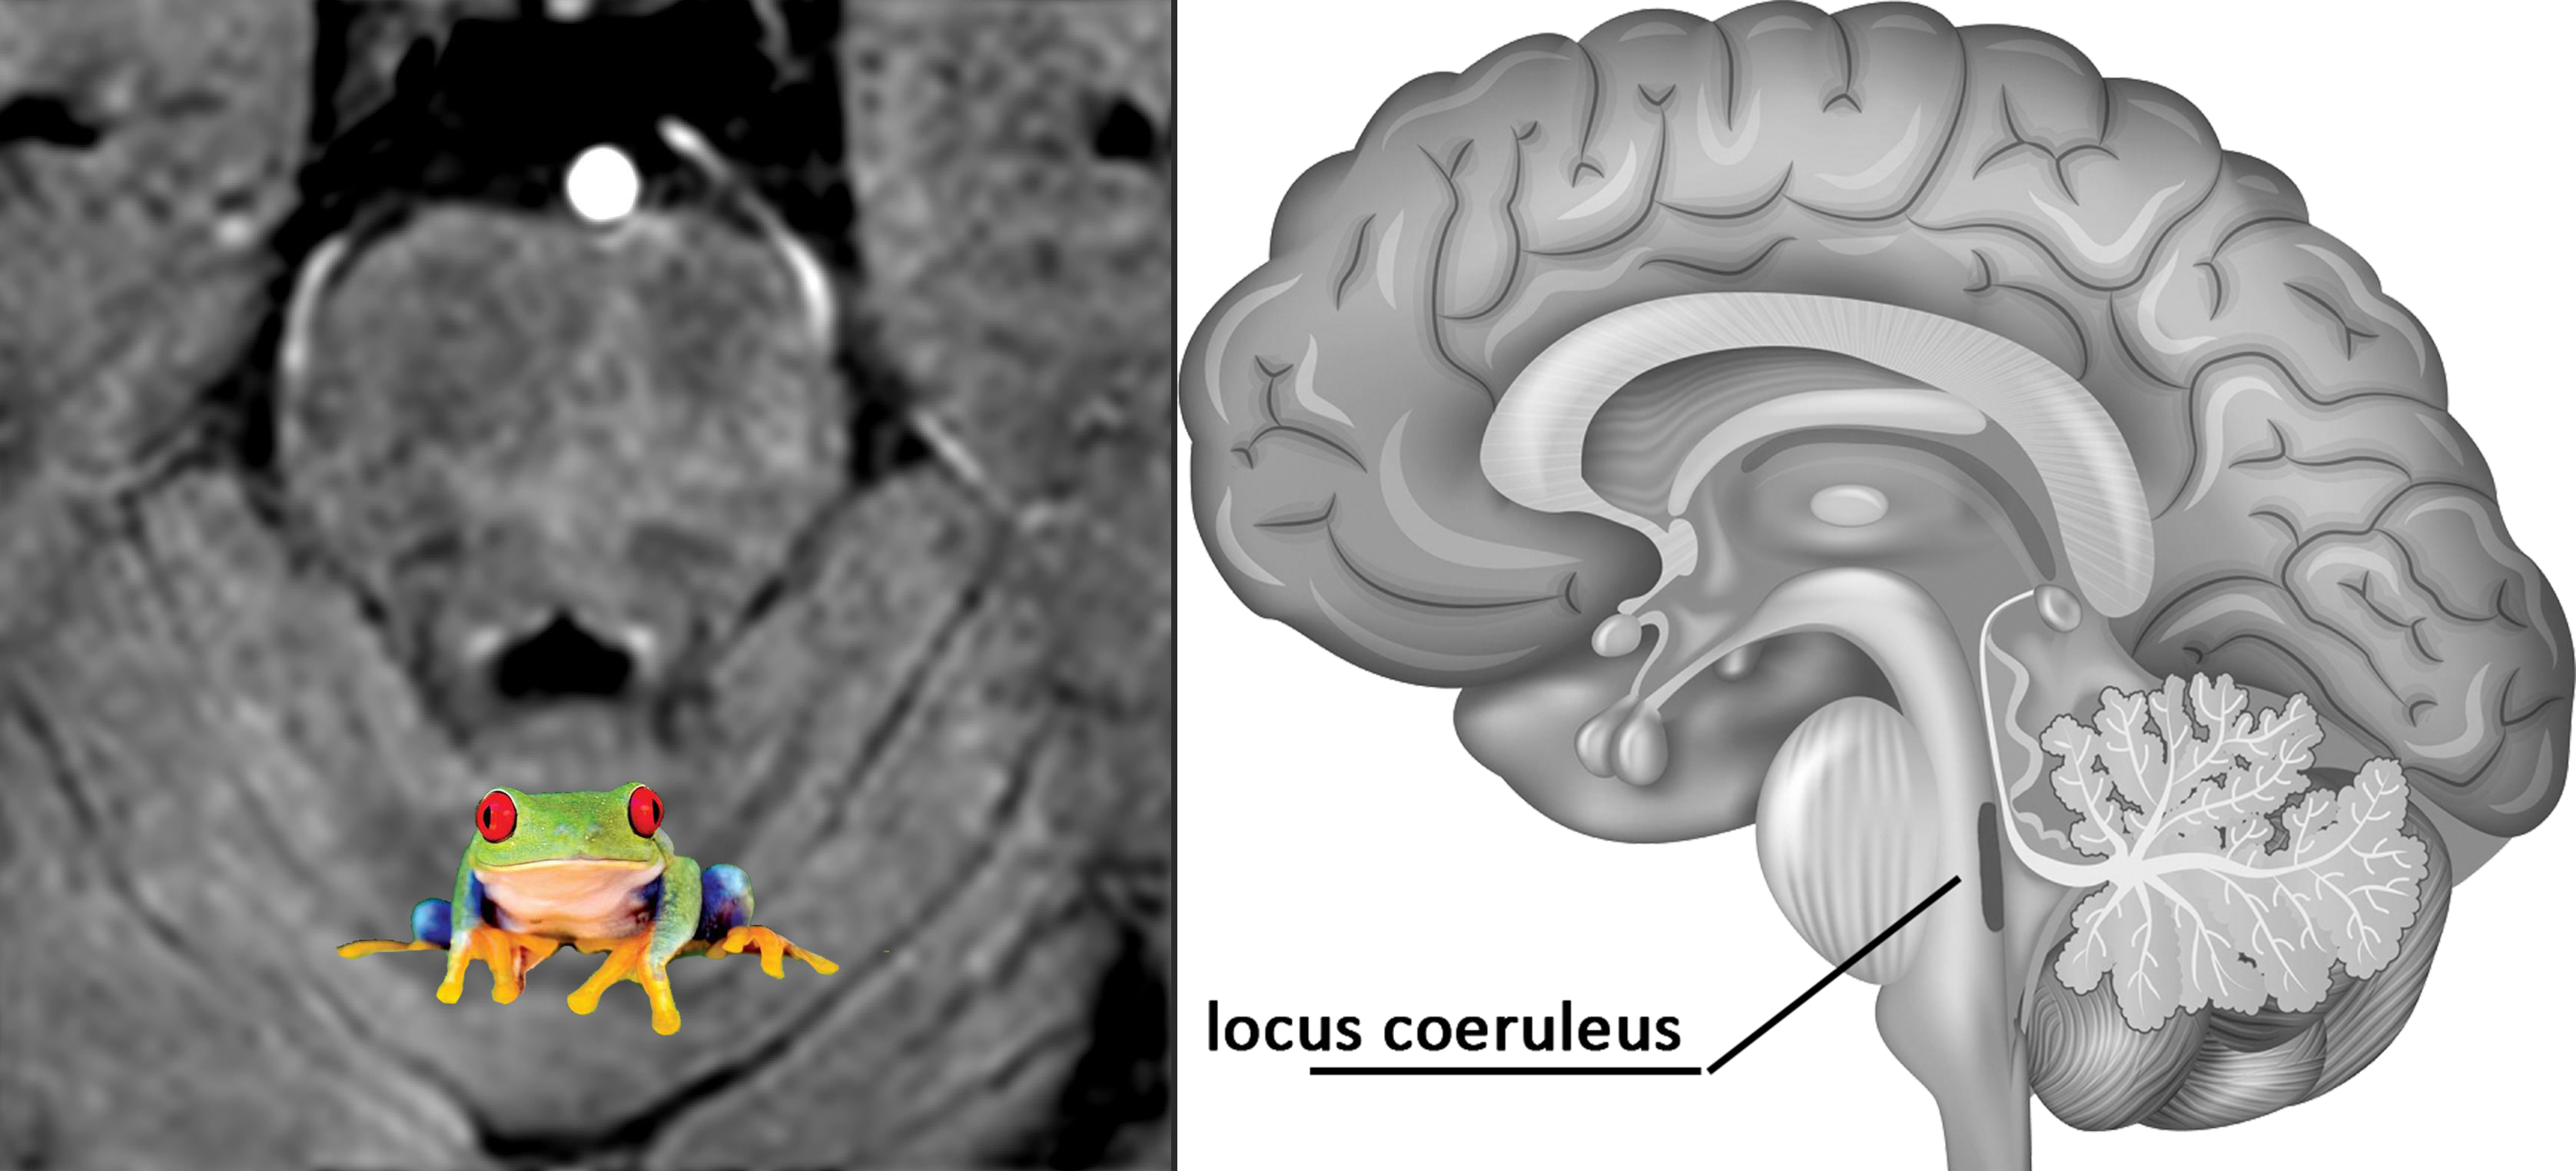
Figure 1.
The two “frog eyes” represent the high signal of the LC. Once we choose the proper imaging parameters,
those little eyes light up. [The frog picture cited from Britannica Insights/7
Awesome Frog Species of the Tropics written by Kara Rogers and the brain
anatomy picture from the photo/Shutterstock.com by
Beth Newcomb February 16, 2016.]