Xiudi Lu1, Linglei Meng2, Yongmin Zhou3, Shaoshi Wang2, Miller Fawaz4, Meiyun Wang5, E. Mark Haacke4, Chao Chai6, Meizhu Zheng7, Jinxia Zhu8, Shuang Xia6, and Yu Luo3
1The First Teaching Hospital of Tianjin University of Traditional Chinese Medicine, Tianjin, China, 2Shanghai Fourth People’s Hospital, Shanghai, China, 3Translational Research Institute of Brain and Brain-Like Intelligence, Shanghai Fourth People’s Hospital Affiliated to Tongji University School of Medicine, Shanghai, China, 4Wayne State University, Detroit, MI, United States, 5Zhengzhou University People’s Hospital, Zhengzhou, China, 6Tianjin First Central Hospital, Tianjin, China, 7Third Central Hospital of Tianjin, Tianjin, China, 8Siemens Healthcare Ltd, Beijing, China
1The First Teaching Hospital of Tianjin University of Traditional Chinese Medicine, Tianjin, China, 2Shanghai Fourth People’s Hospital, Shanghai, China, 3Translational Research Institute of Brain and Brain-Like Intelligence, Shanghai Fourth People’s Hospital Affiliated to Tongji University School of Medicine, Shanghai, China, 4Wayne State University, Detroit, MI, United States, 5Zhengzhou University People’s Hospital, Zhengzhou, China, 6Tianjin First Central Hospital, Tianjin, China, 7Third Central Hospital of Tianjin, Tianjin, China, 8Siemens Healthcare Ltd, Beijing, China
Quantitative measurement of APCV volume using SWIM is as accurate in delineating the hypoperfusion area as PWI. The measurement of SWIvolume-DWI mismatch provides an alternative to PWI-DWI mismatch in delineating the penumbra in acute ischemic stroke cases.

Figure1.Volume of asymmetrical prominent cortical veins (APCVs) and Alberta Stroke Program Early CT Score (ASPECTS) measurements using susceptibility-weighted imaging and mapping (SWIM) images. (A, B) Regions of interest were drawn surrounding the APCVs on the SWIM images. The areas and volumes were obtained using Software Process Improvement Network (SPIN) software. (C, D) One point was subtracted from a maximum of 10 (caudate nucleus, lenticular nucleus, internal capsule, a territory of M1 to M6, and an insular lobe) for each area with an ischemic change.
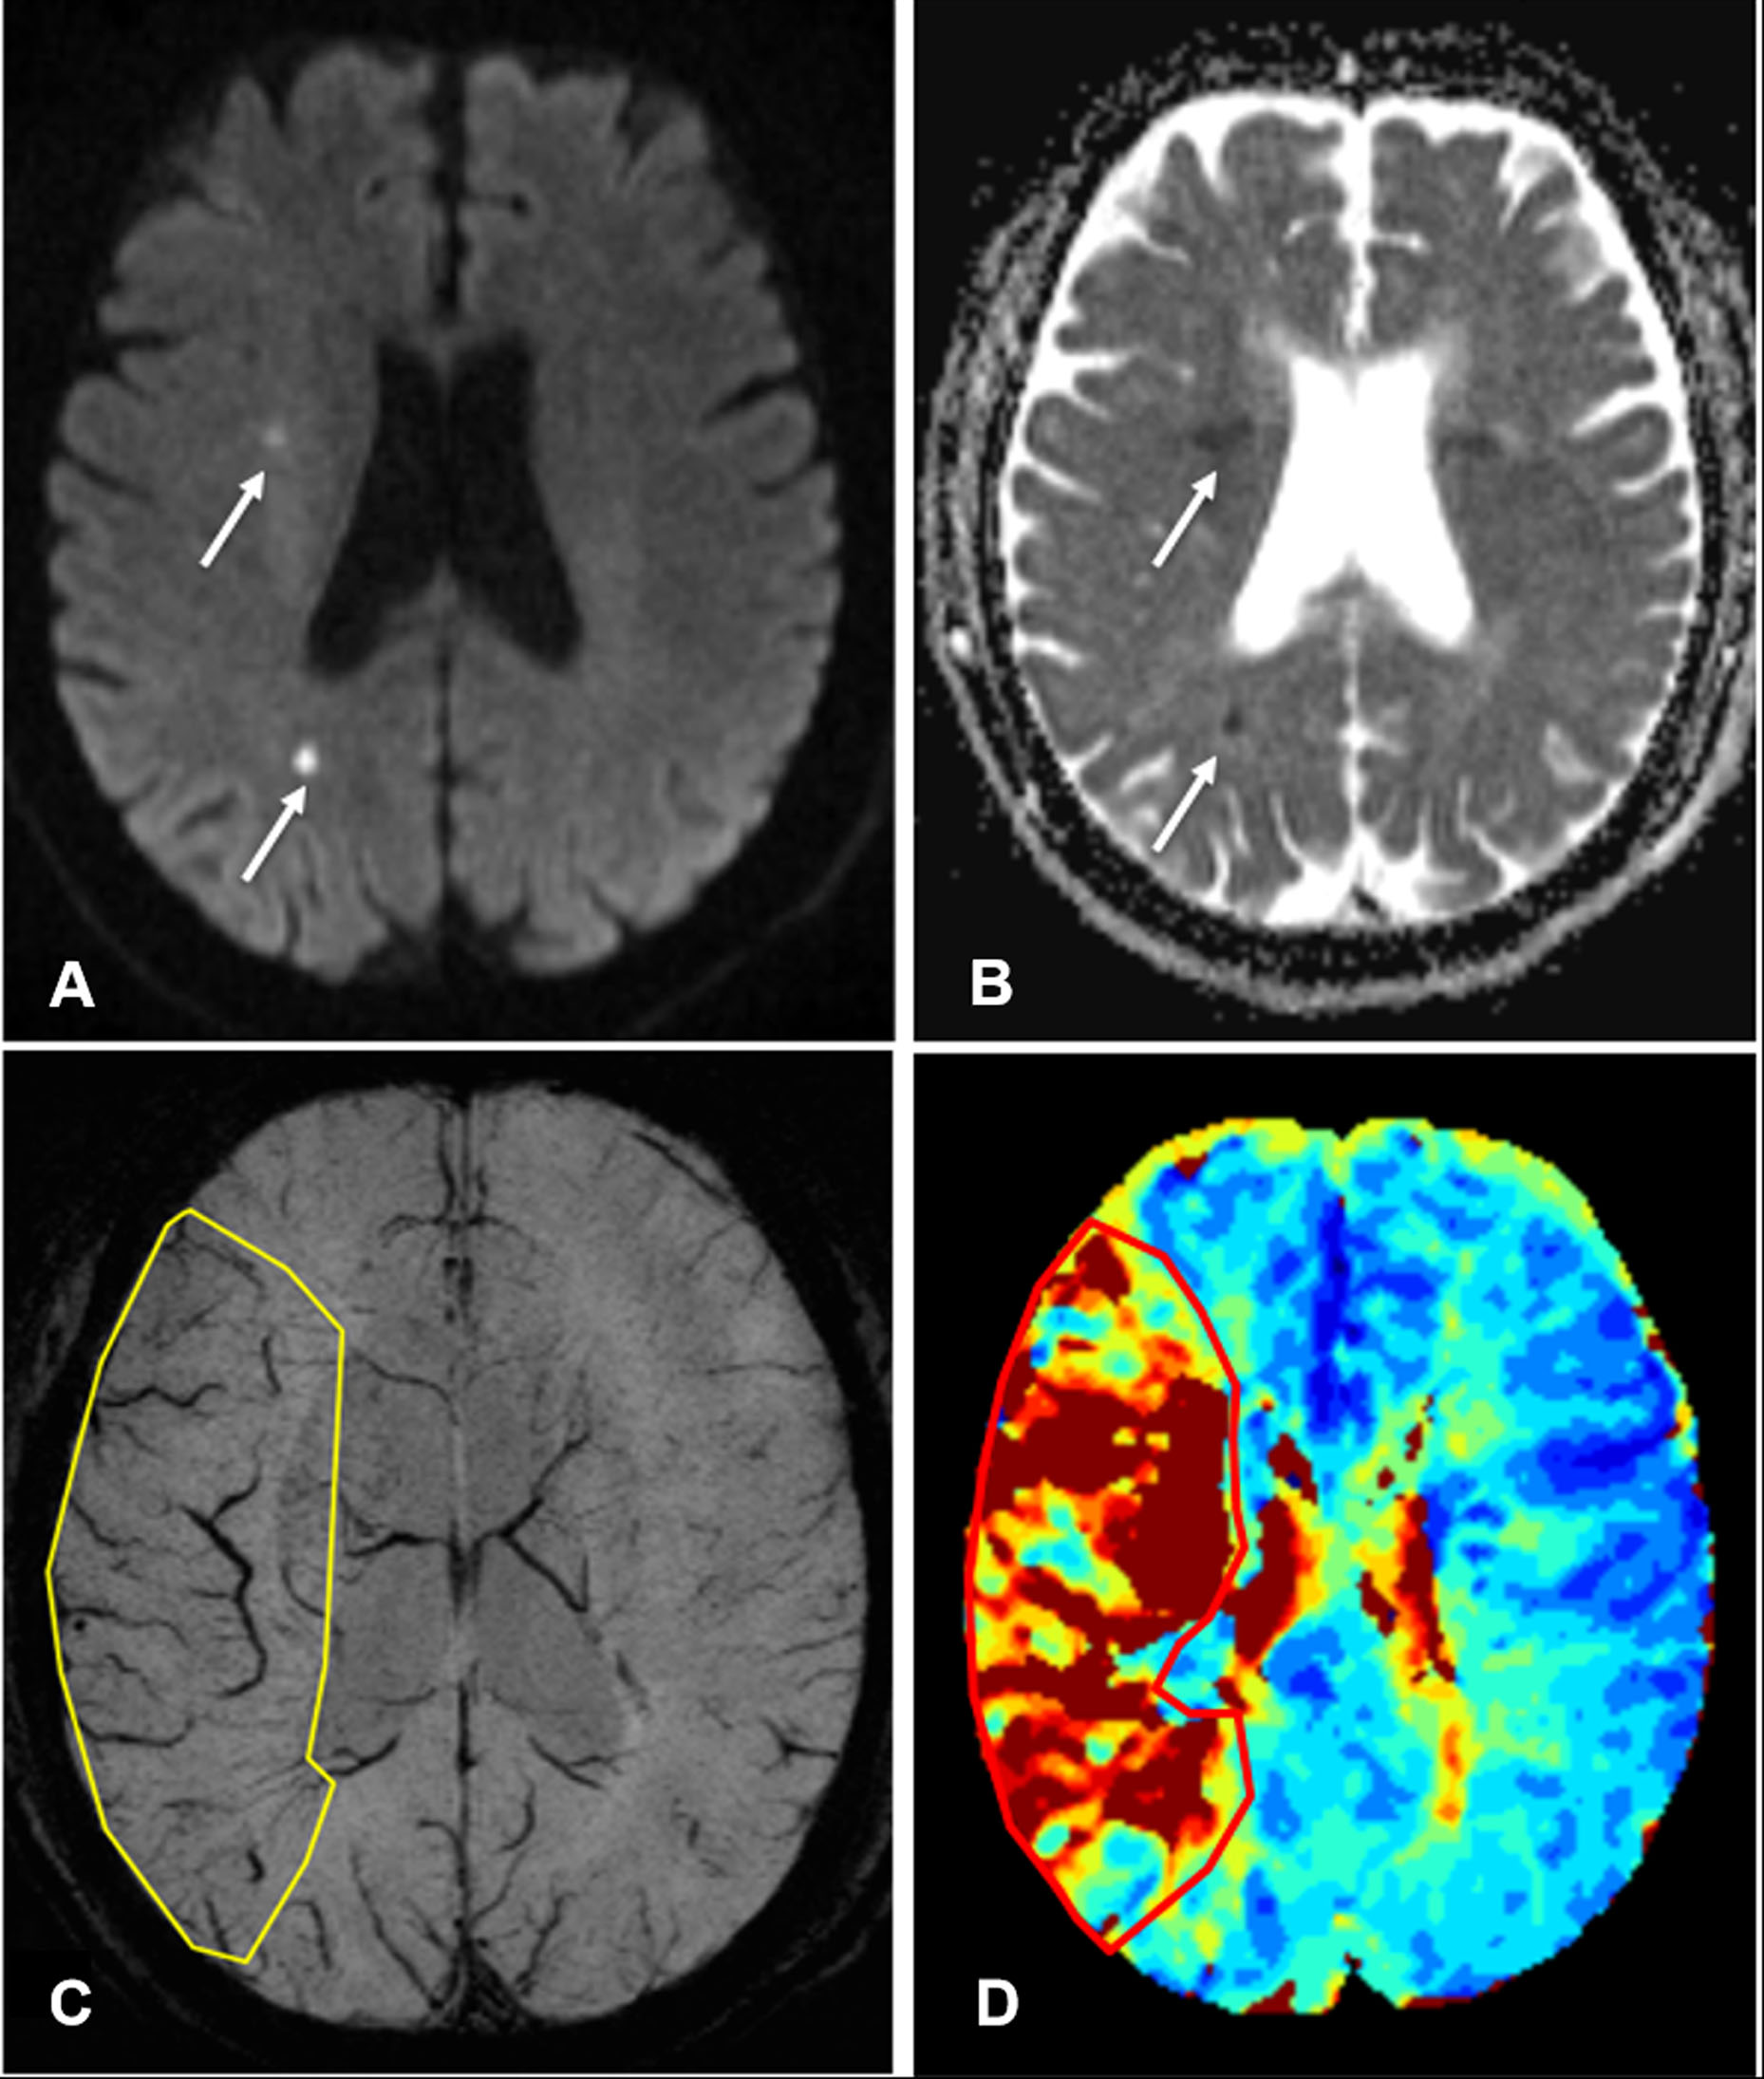
Figure2.A patient with left limb weakness 1h before MRI examination showed positive of susceptibility-weighted imaging (SWI)volume-DWI mismatch and perfusion-weighted imaging (PWI)-DWI mismatch. (A) Diffusion-weighted imaging (DWI) shows a few small hyperintense lesions (arrows) and (B) The apparent diffusion coefficient (ADC) map shows a few hypointense lesions (arrows). (C) The asymmetrical prominent cortical vein (APCV) region in SWI maximum intensity projections (MIPs)(yellow box). (D) The Time-to-maximum (Tmax) >6s map shows hypoperfused lesion(red box).