Guifang Lin1, Lili Wang1, Zhongshuai Zhang2, Bin Sun1, Weiwen lin1, Ruolan Lin1, Jingming Chen1, Jiangao Xie1, Yuanfeng Liu1, Qing Duan1, and Yunjing Xue1
1Department of Radiology, Fujian Medical University Union Hospital, Fuzhou, China, 2SIEMENS Healthcare, Shanghai, China
1Department of Radiology, Fujian Medical University Union Hospital, Fuzhou, China, 2SIEMENS Healthcare, Shanghai, China
ADC, MD, MK and D value measured from S8,
S5/8, S5 and S3 which delegating different level of liver tissue can be chosen
for the quantitative evaluation of hepatic parenchyma.
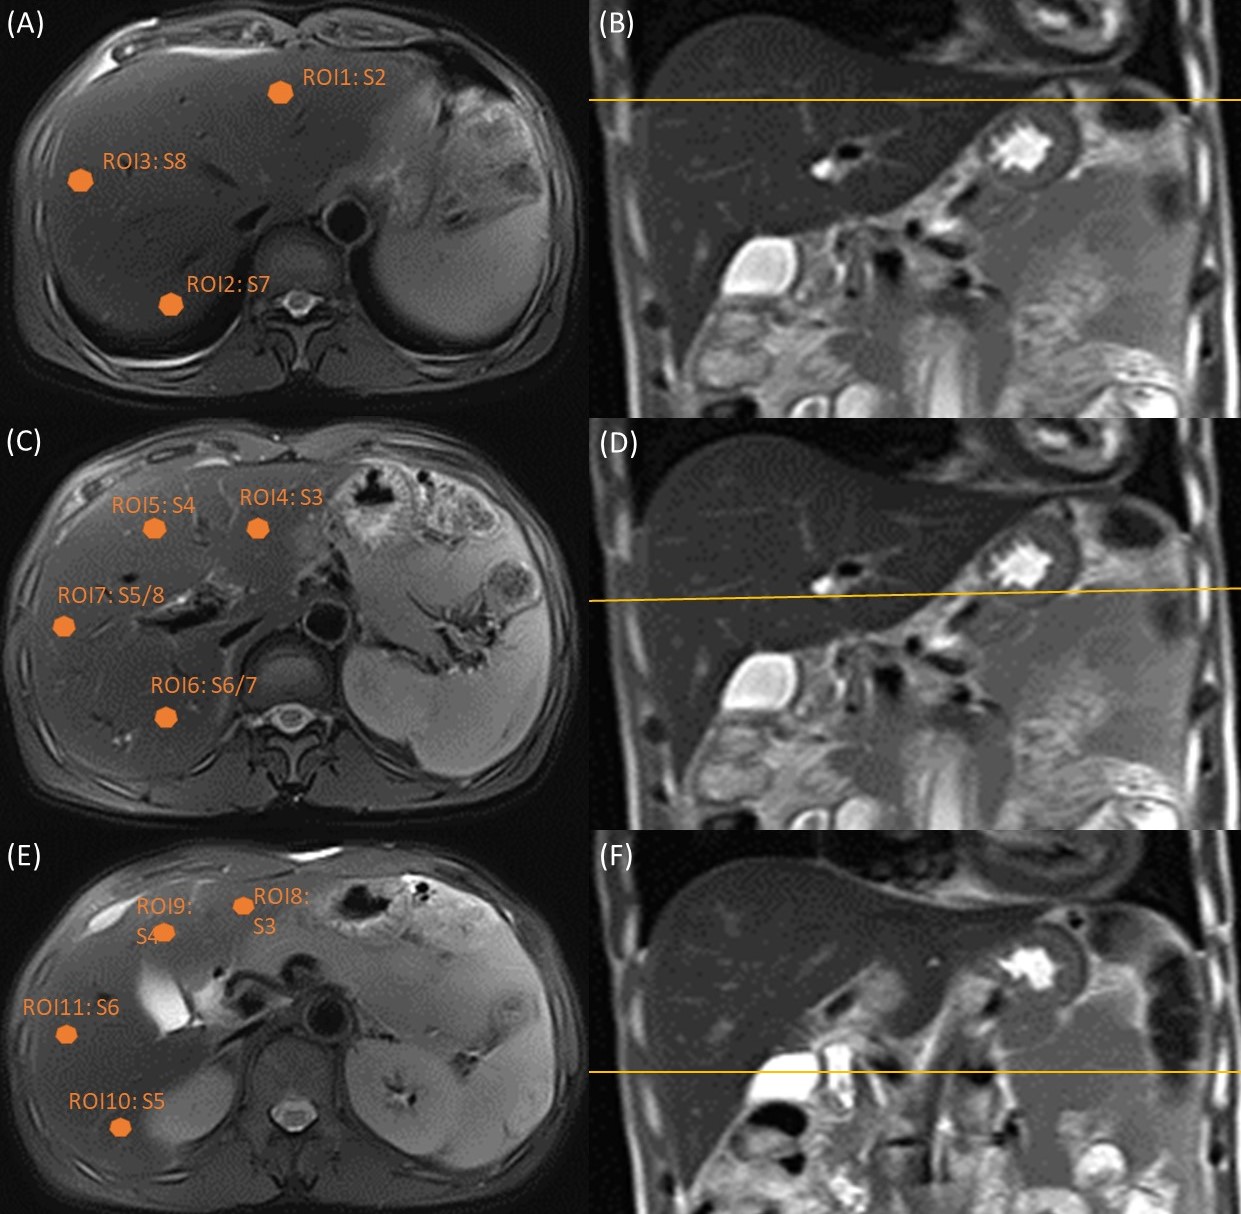
Figure 1 : The first 3 ROIs were drawn in
the transverse cranial liver slice with right hepatic vein: left lateral lobe
(ROI1, S2) and right lobe (ROI2, S7 and ROI3, S8). The fourth to seventh regions
were drawn in the medial liver slice with right portal vein trunk: left lobe
(ROI4, S3 and ROI5, S4) and right lobe (ROI6, S6/7 and ROI7, S5/8). The eighth
to eleventh regions were drawn in the caudal liver with gallbladder fossa: left
lobe (ROI8, S3 and ROI9, S4) and right lobe (ROI10, S5 and ROI11, S6).
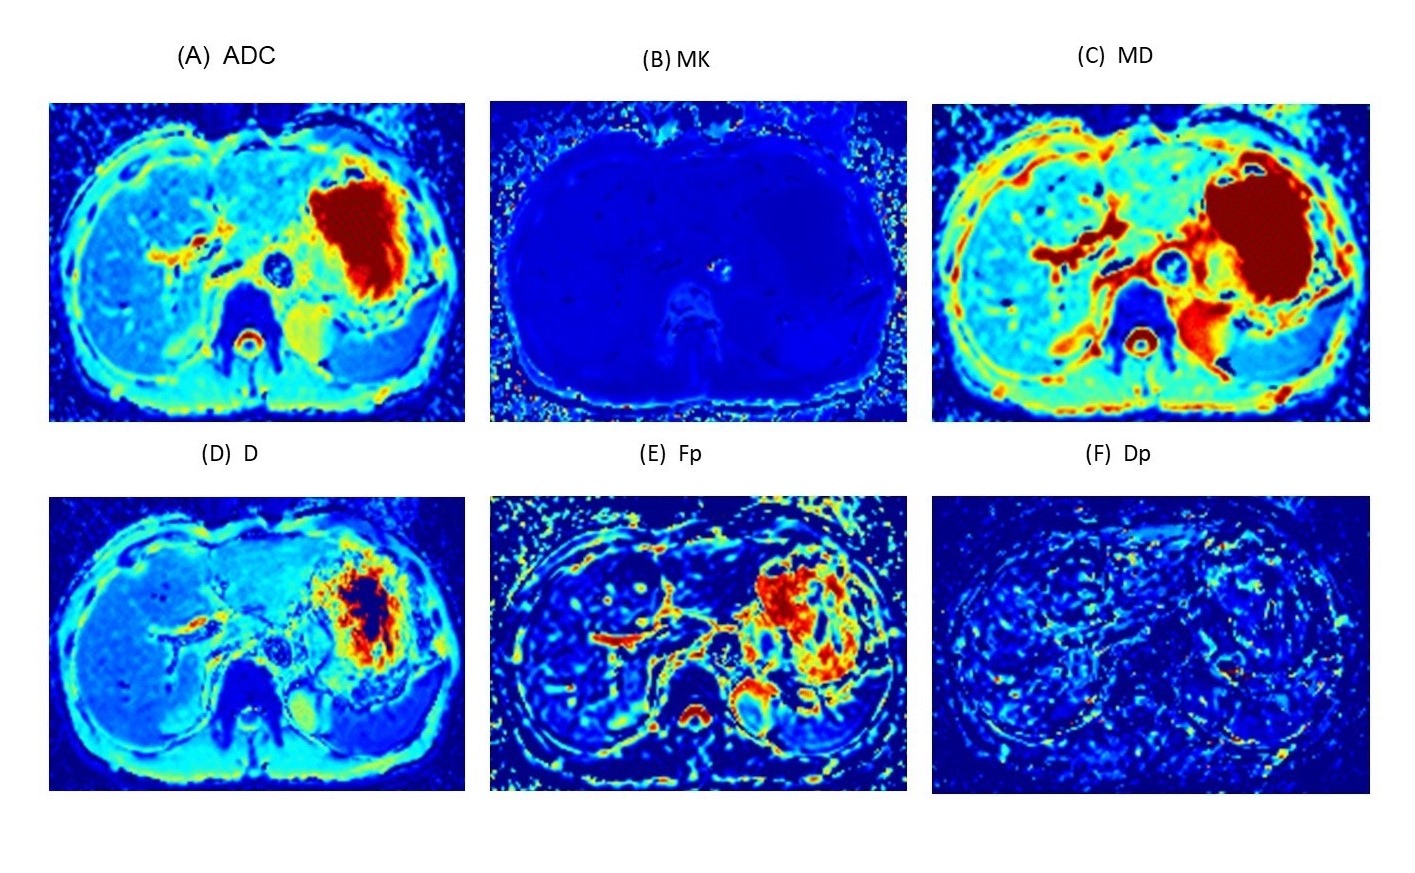
Figure 2: Example parametric maps of the
medial liver from a 64 years-old patient with GIST. The ADC (A), MK (B), MD (C) and D (D) map
shows more homogeneous distribution compared with Fp (E) and Dp (F) map. Parameters
of lateral left lobe were different from other regions of liver due to the
influence of cardiac movement.