Qingqing Wen1, Kang Wang2, Yi-Cheng Hsu3, Yi Sun3, Dan Wu1,2, and Yi Zhang1,2
1Key Laboratory for Biomedical Engineering of Ministry of Education, Department of Biomedical Engineering, College of Biomedical Engineering & Instrument Science, Zhejiang University, Hangzhou, China, 2Department of Neurology, First Affiliated Hospital, College of Medicine, Zhejiang University, Hangzhou, China, 3Siemens Healthcare Ltd., Shanghai, China
1Key Laboratory for Biomedical Engineering of Ministry of Education, Department of Biomedical Engineering, College of Biomedical Engineering & Instrument Science, Zhejiang University, Hangzhou, China, 2Department of Neurology, First Affiliated Hospital, College of Medicine, Zhejiang University, Hangzhou, China, 3Siemens Healthcare Ltd., Shanghai, China
CEST imaging was applied to
epilepsy patients with Tuberous Sclerosis Complex (TSC) for the first
time, with radio-frequency saturation power, duration and frequency offsets
optimized. Distinct
CEST contrast between cortical tubers and normal tissues was demonstrated for
TSC epilepsy.
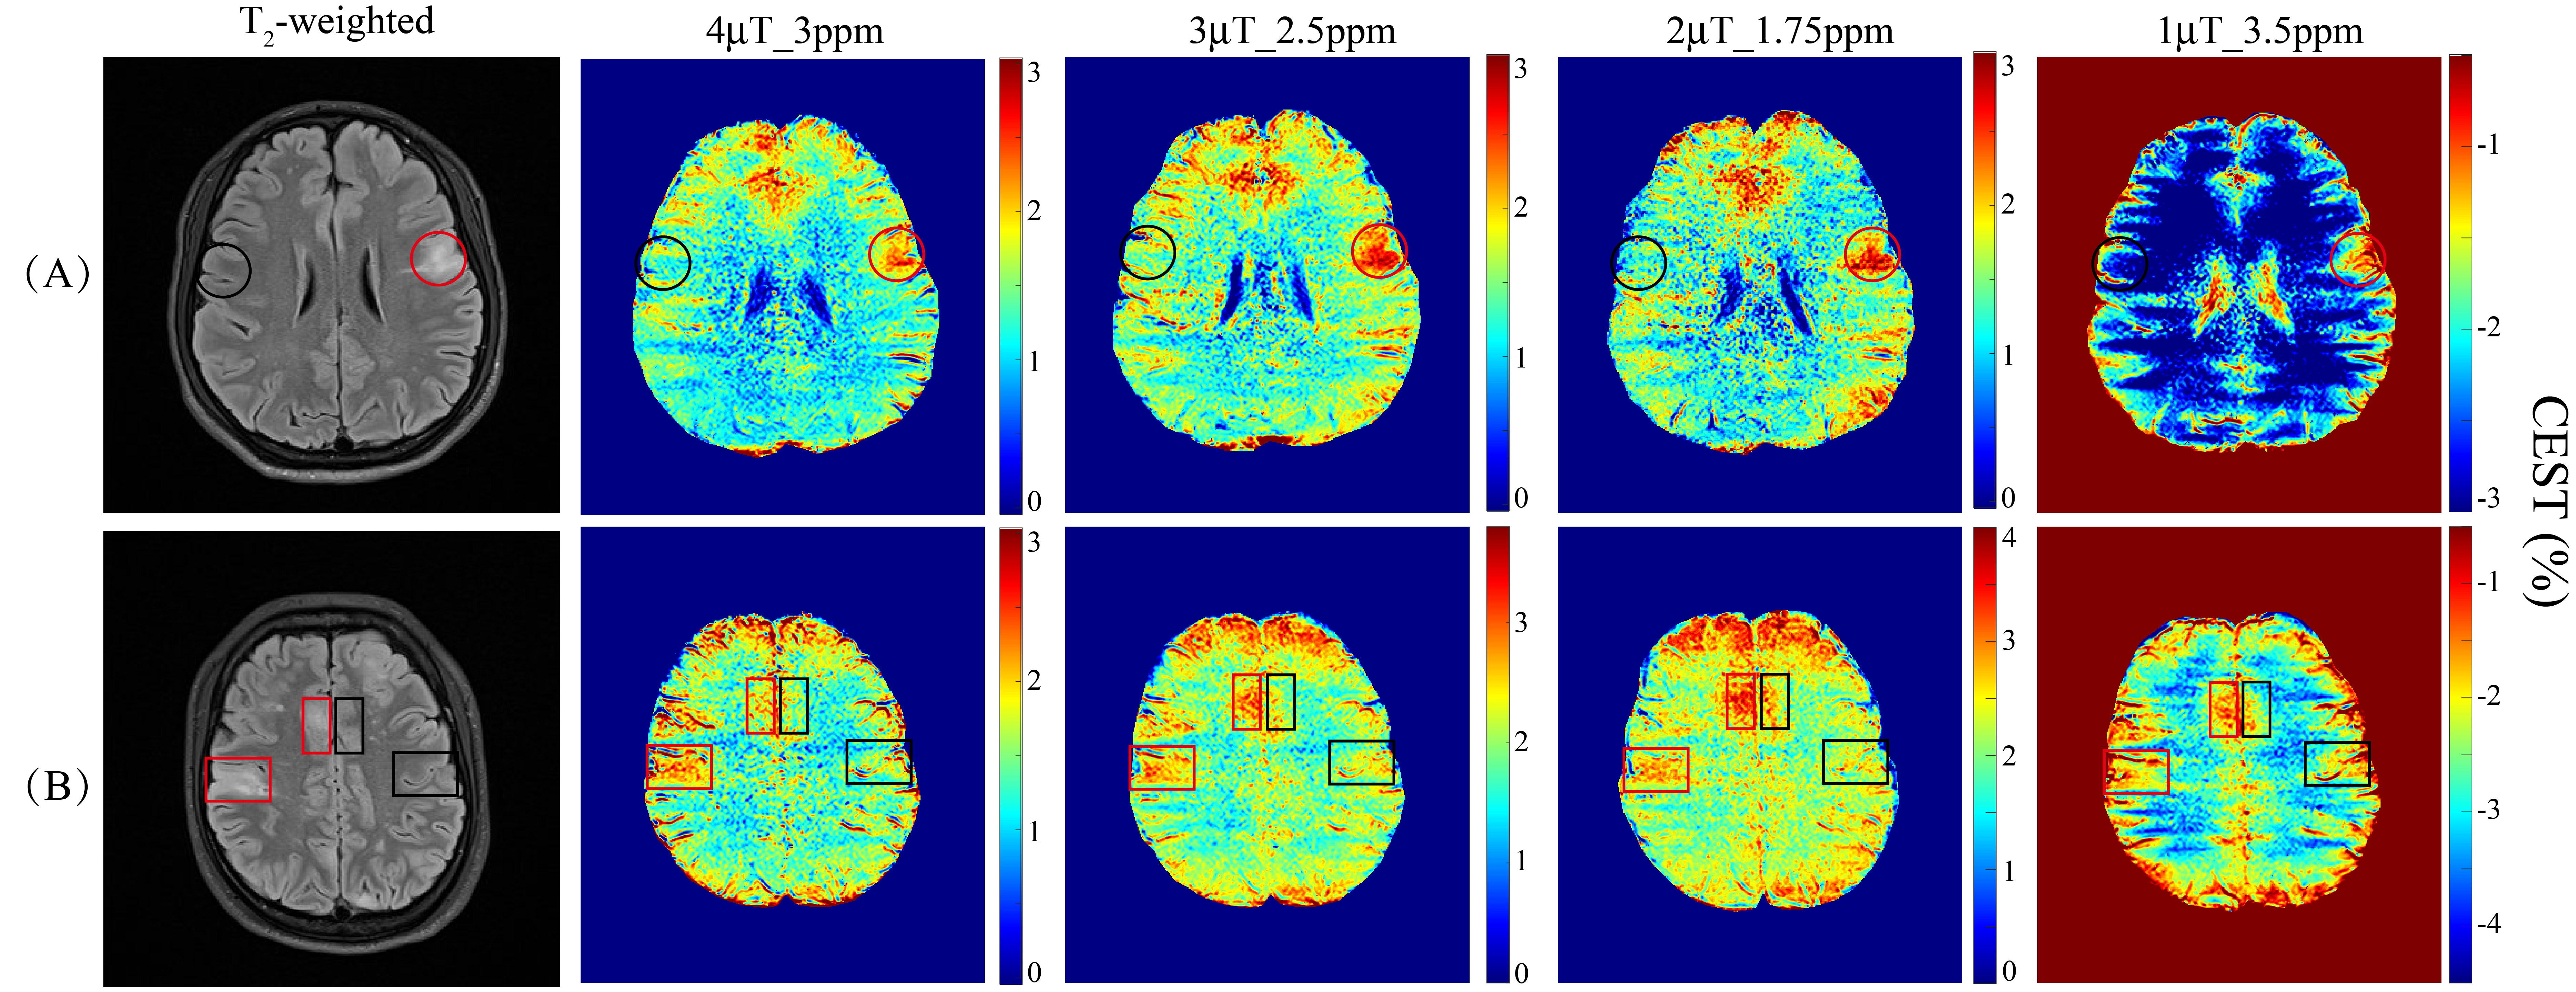
Figure 4. CEST maps from two TSC patients at 3T. The anatomical
images are shown in the first column. The second column shows CEST maps at 3ppm
with a B1 of 4μT. The third column shows CEST images at 2.5ppm
using 3μT saturation power. CEST maps
at 1.75ppm (B1=2μT) and
3.5ppm (B1=1μT) are shown in the fourth
and the last column, respectively. Tubers (red lines) show hyperintensity compared
to the contralateral areas (black lines).
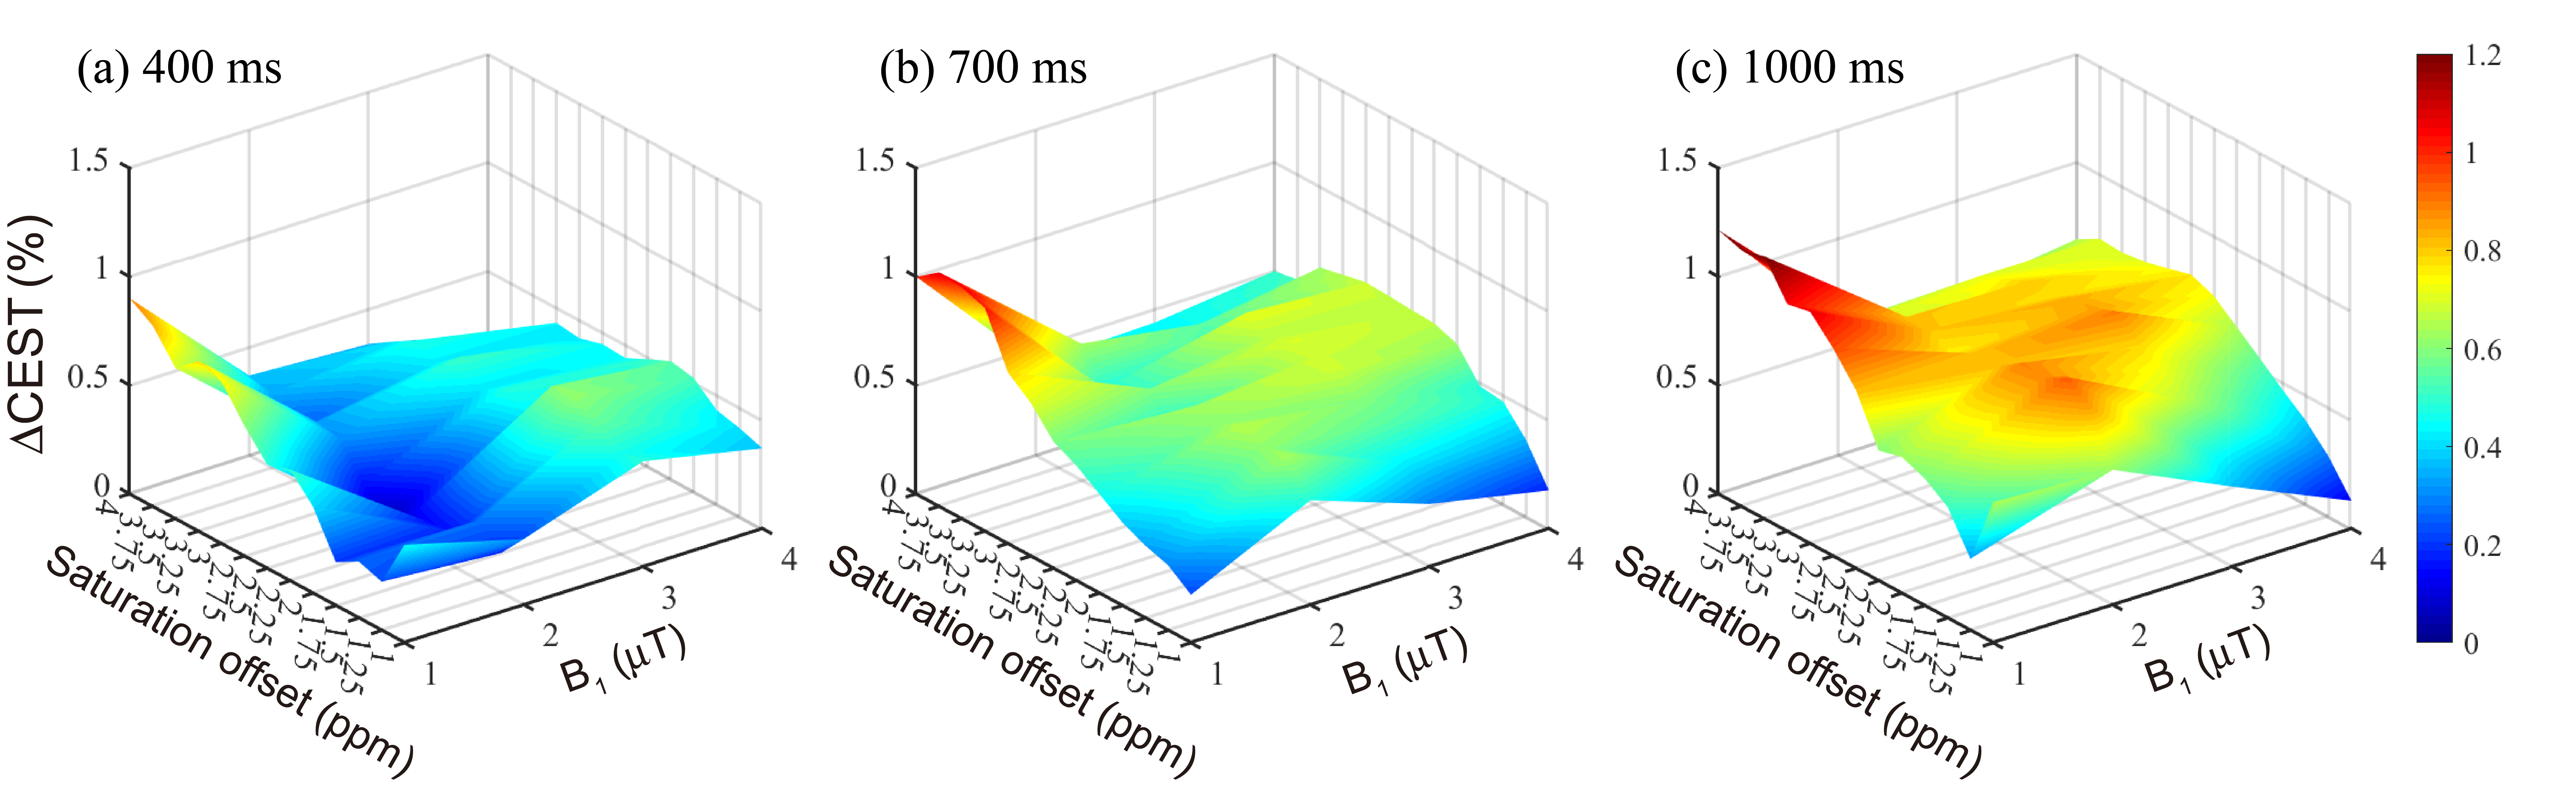
Figure 1. The average CEST contrast (ΔCEST) between tubers and normal white matter as
a function of RF saturation power (B1) and frequency offsets for
saturation duration of 400ms (a), 700ms (b), and 1000ms (c), respectively.