1Radiological Sciences, Tokyo Metropolitan University, Tokyo, Japan, 2National Institute of Advanced Industrial Science and Technology (AIST), Tsukuba, Japan, 3Tokyo Metropolitan University, Tokyo, Japan, 4Keio University Hospital, Tokyo, Japan, 5Tokyo Denki University, Tokyo, Japan
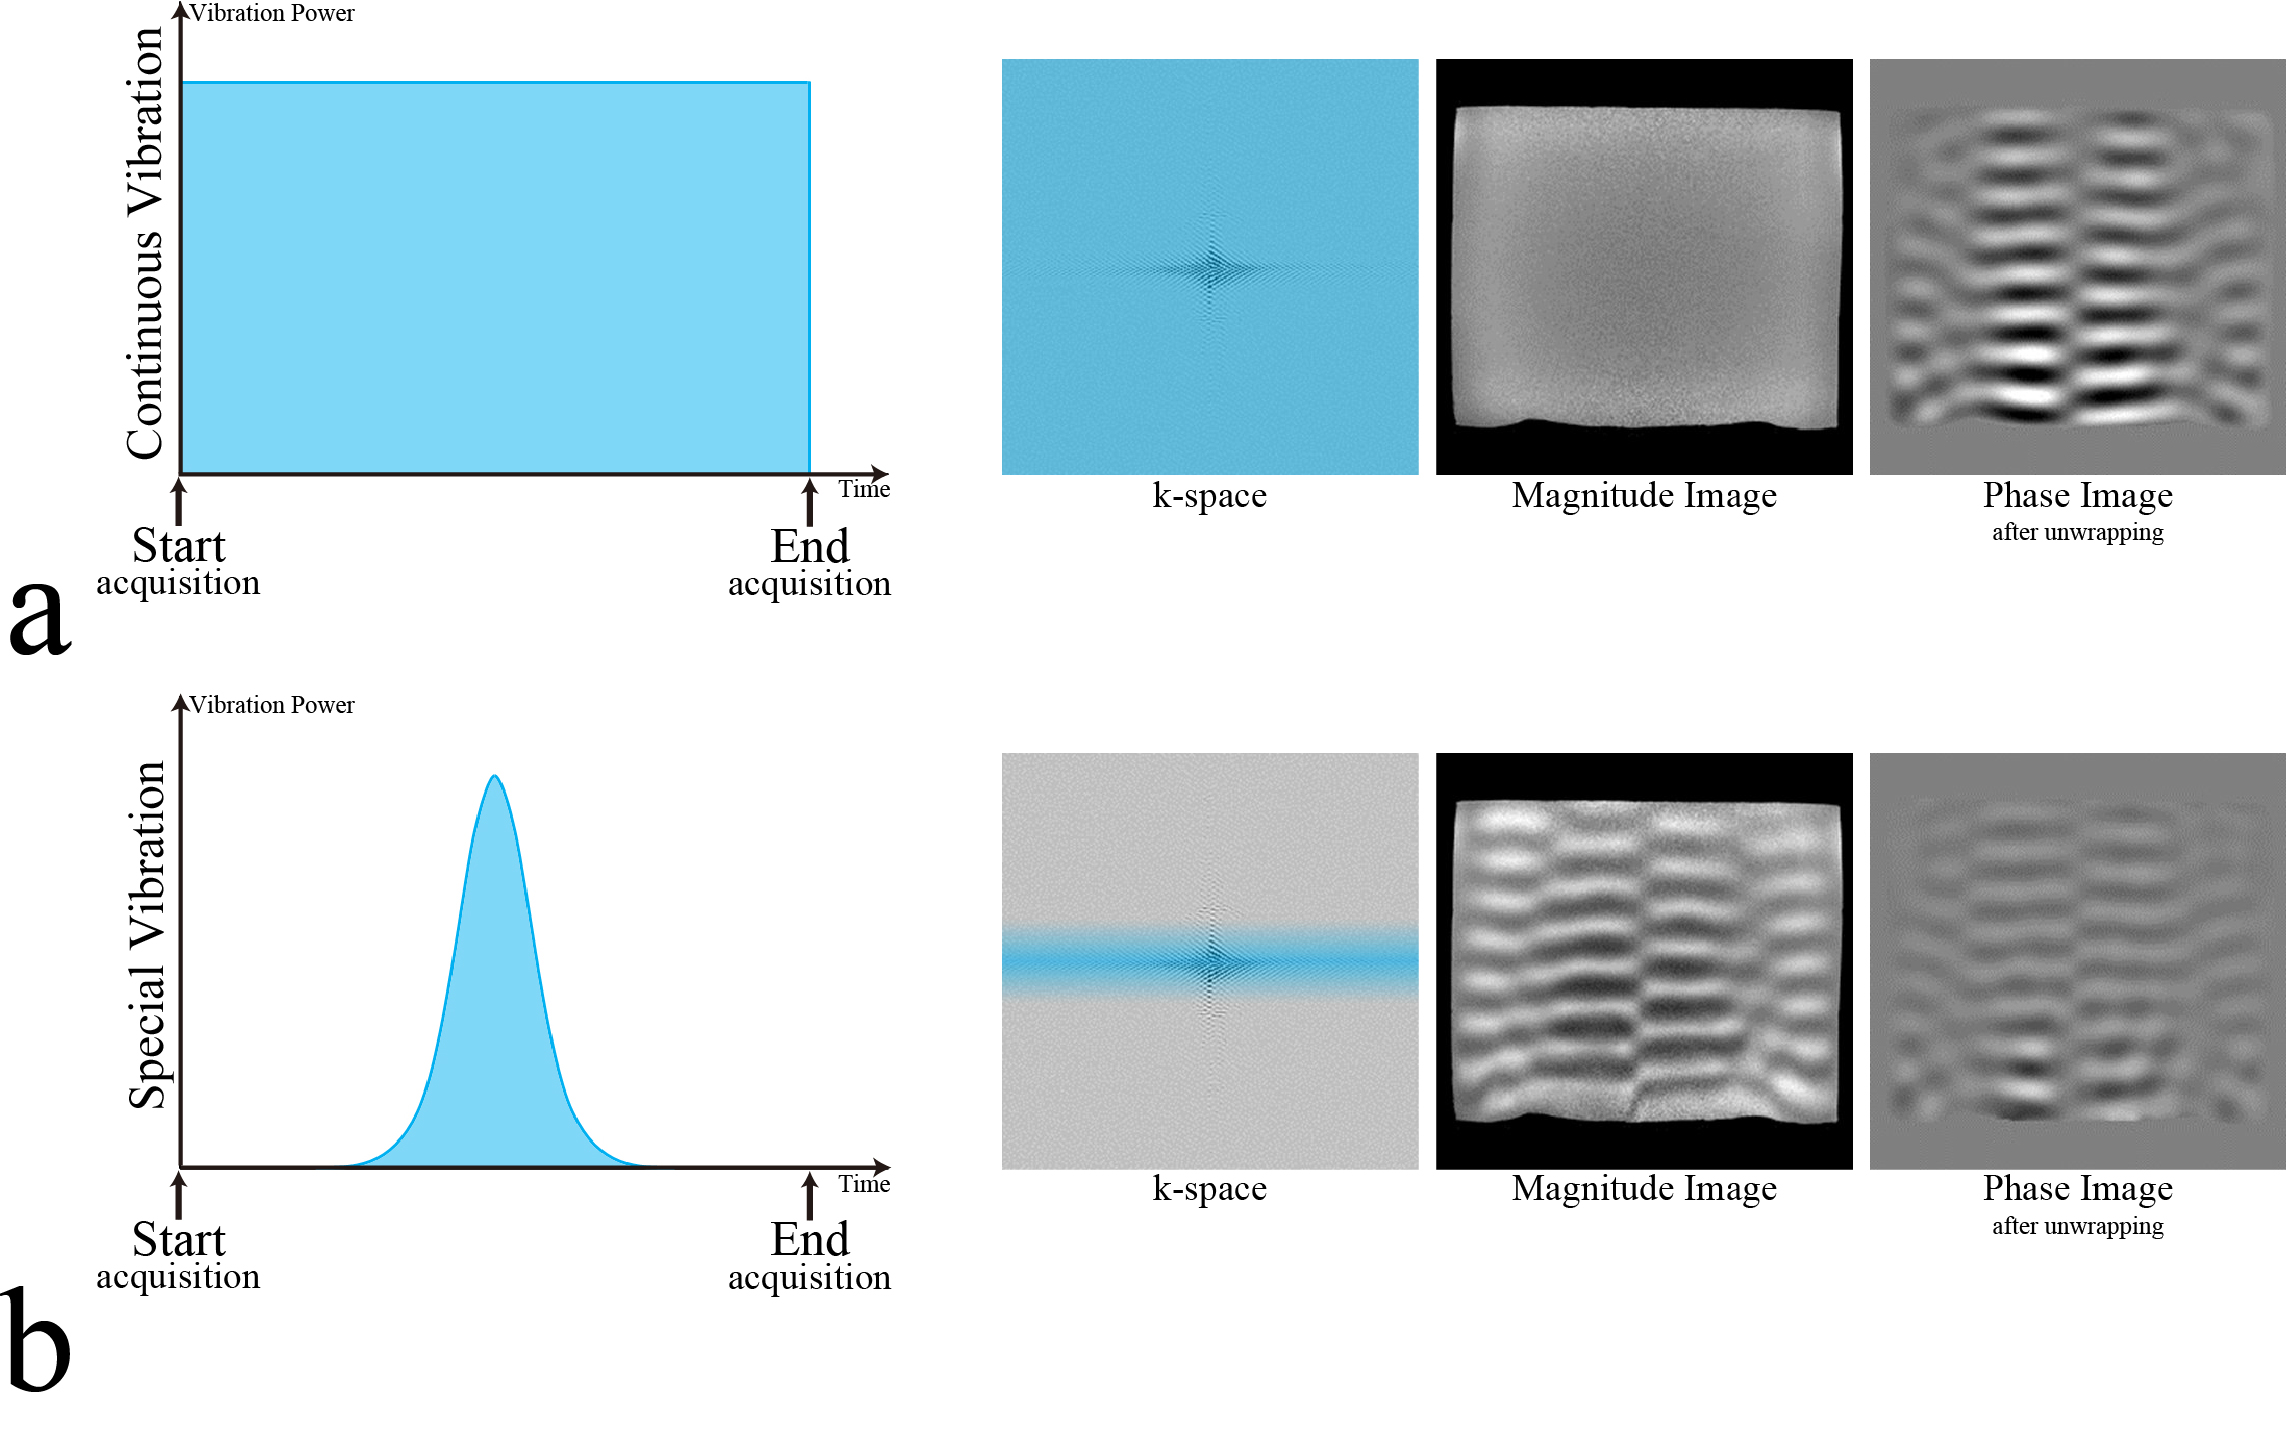
MR magnitude image MRE (MI-MRE)
a: The vibration effect of k-space in the continuous vibration is convolved in all spatial frequency domains as all area of k-space. The shear wave information was visualized on only MR phase image. b: The vibration effect of k-space in the special vibration is selectively convolved in only low-spatial frequency domain as only blue area of k-space. The shear wave information was visualized on both images. The shear wave information of phase image was low visibility compared with the one of continuous vibration.
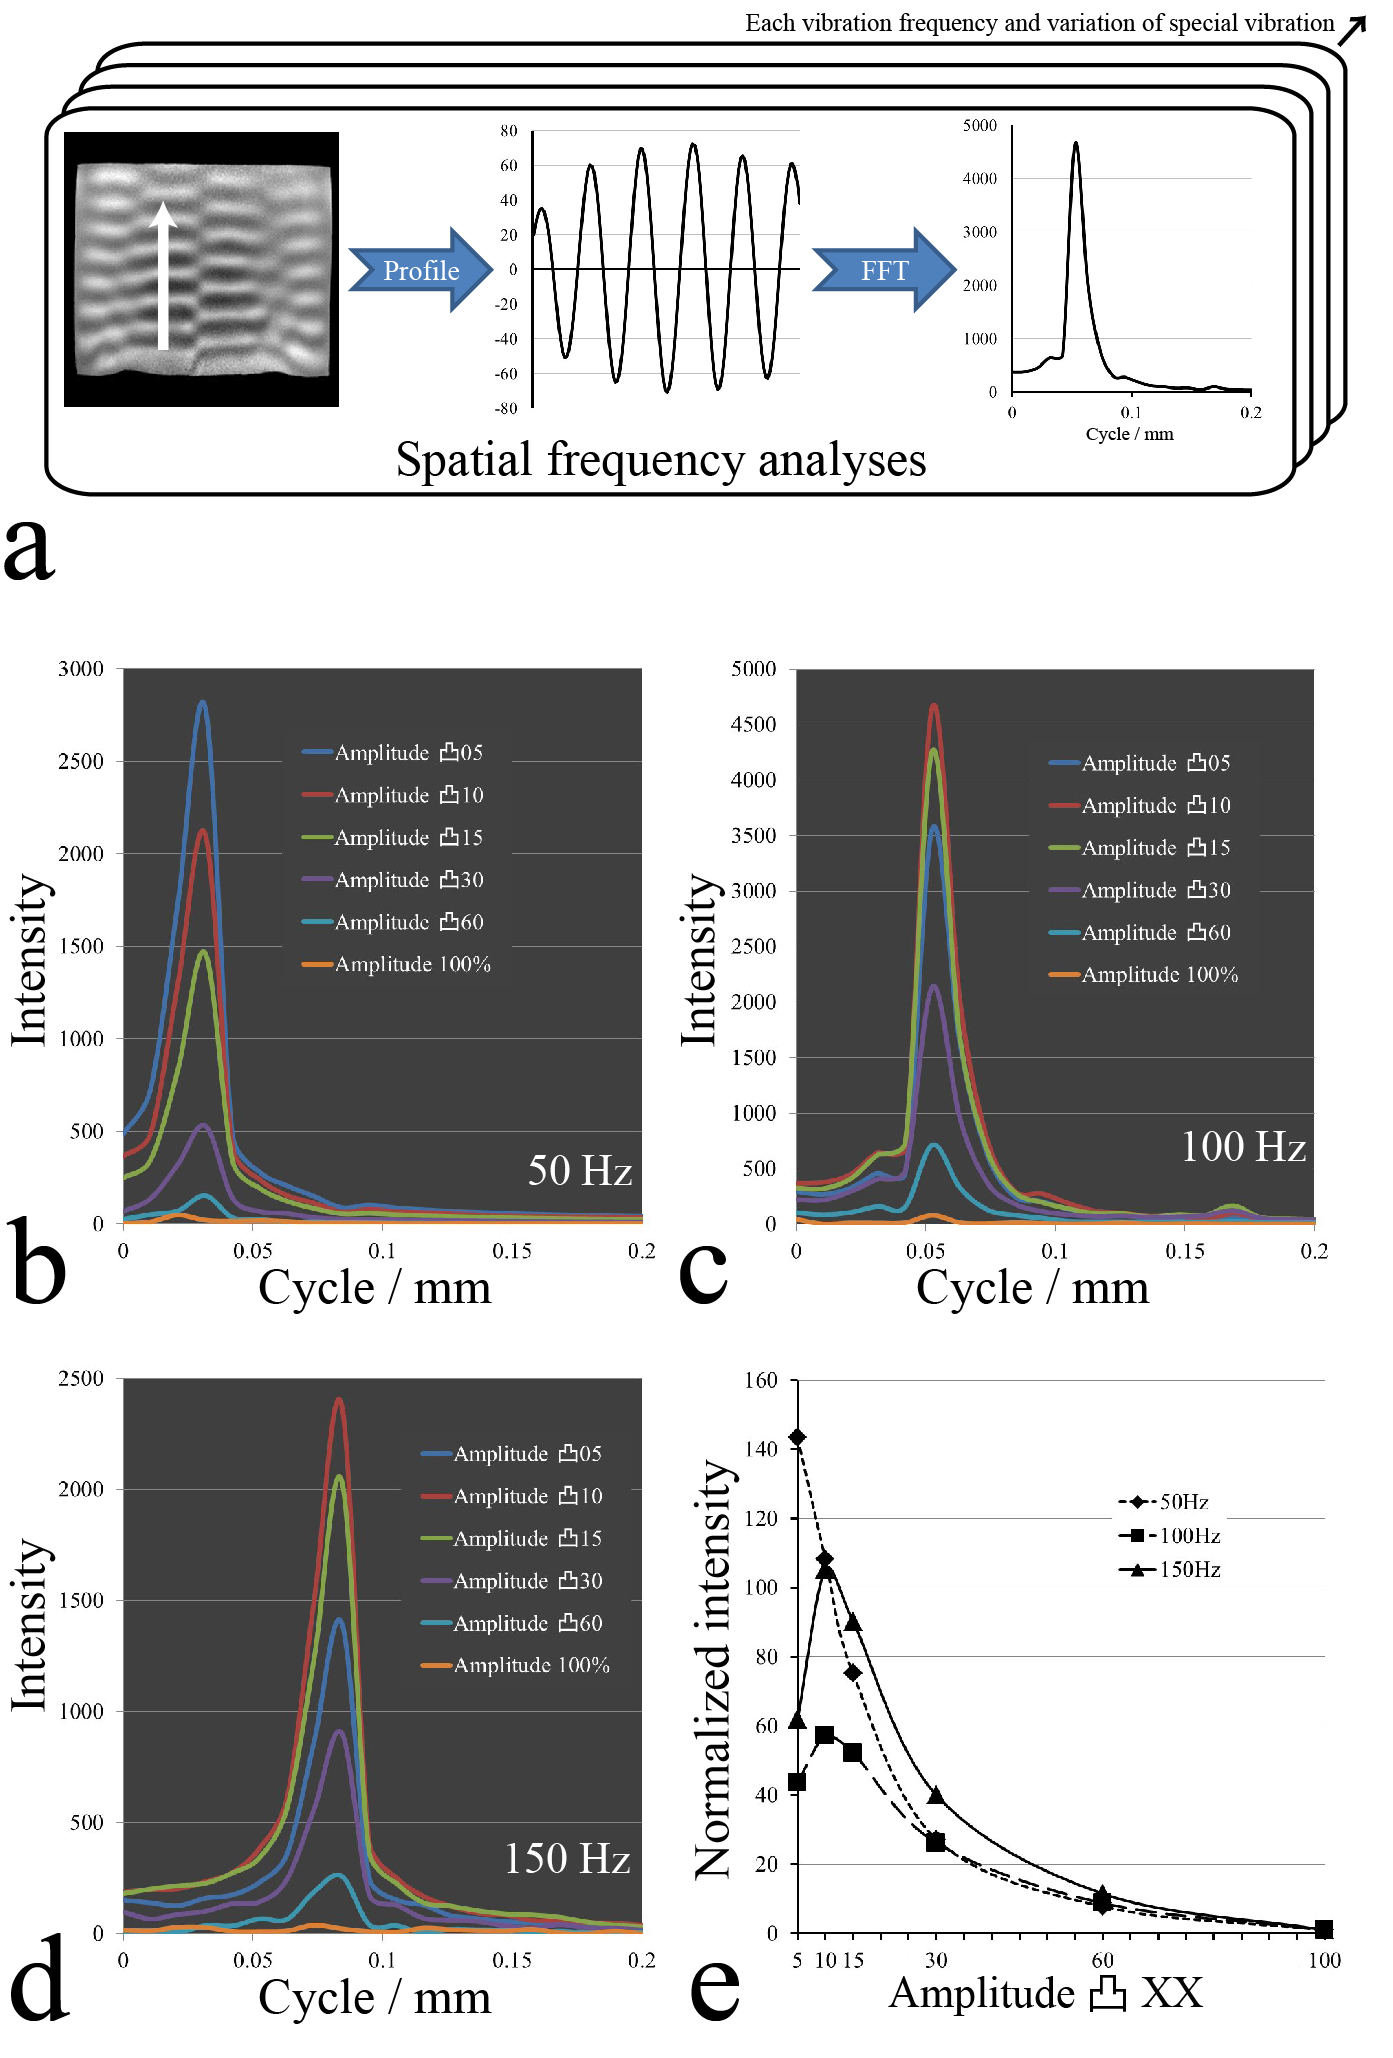
Spatial frequency analyses of special vibration
a: Process of spatial frequency analyses. This process was performed at each vibration frequency and special vibration. b,c,d: The results of each spatial frequency analyses were organized into charts of each vibration frequency. In each vibration frequency, the spatial frequency was the same, but the intensity changed. e: The normalized intensity of each spatial frequency analyses were organized into chart. Amplitude Convex 05 lack the high spatial frequency domain, which reduces the normalized intensity at 100 Hz and 150 Hz.