Wending Tang1, Xing Wei2, Muheng Li1, Fuyixue Wang3,4, Zijing Dong3,5, Danna Wei6, Kawin Setsompop3,4,5, and Karen Ying1
1Department of Engineering Physics, Tsinghua University, Beijing, China, 2Orthopedic Department, Aerospace Center Hospital, Beijing, China, 3Athinoula A. Martinos Center for Biomedical Imaging, Massachusetts General Hospital, Charlestown, MA, United States, 4Harvard-MIT Health Sciences and Technology, Massachusetts Institute of Technology, Cambridge, MA, United States, 5Department of Electrical Engineering and Computer Science, Massachusetts Institute of Technology, Cambridge, MA, United States, 6Department of Biomedical Engineering, School of Medicine, Tsinghua University, Beijing, China
1Department of Engineering Physics, Tsinghua University, Beijing, China, 2Orthopedic Department, Aerospace Center Hospital, Beijing, China, 3Athinoula A. Martinos Center for Biomedical Imaging, Massachusetts General Hospital, Charlestown, MA, United States, 4Harvard-MIT Health Sciences and Technology, Massachusetts Institute of Technology, Cambridge, MA, United States, 5Department of Electrical Engineering and Computer Science, Massachusetts Institute of Technology, Cambridge, MA, United States, 6Department of Biomedical Engineering, School of Medicine, Tsinghua University, Beijing, China
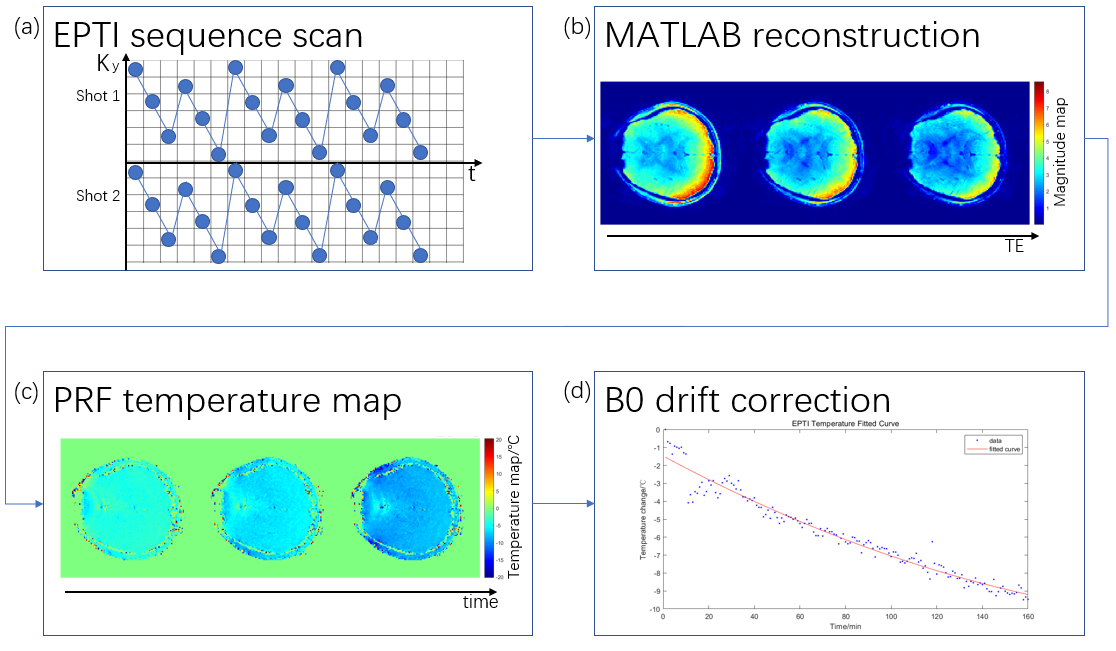
EPTI sequence can higher can greatly improve the time resolution of temperature measurement without image distortion and blurring.
Figure
1. An illustration of the
experiment steps, using the brain as an example. (a) is sampling patterns of the
EPTI sequence in k-space. Each dot here represents an EPTI readout line. (b)
shows the MATLAB reconstructed result, indicating the magnitude and phase map
of each TE. (c) is temperature maps of different times, using the PRF method.
(d) shows the temperature trend of a specific point of the brain before
corrections (blue dots), and the lower-order
polynomial model of B0 effect (red line).
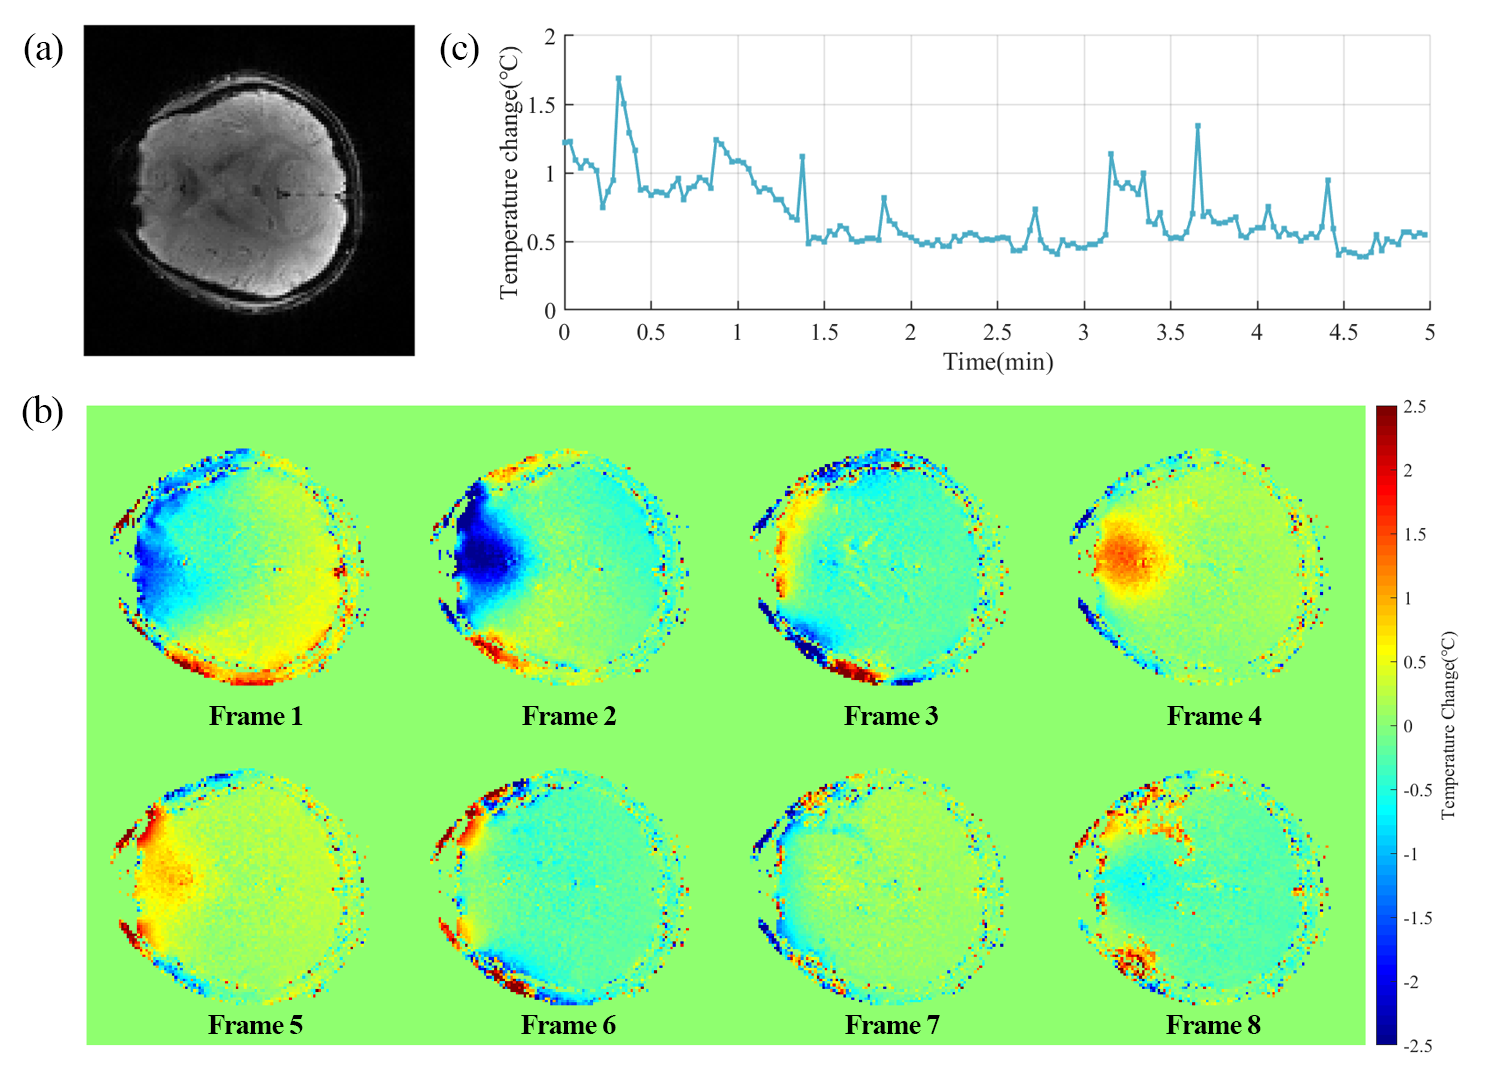
Figure 4. Temperature measurements of a human brain
based on the EPTI sequence. (a) Magnitude images of human brain acquired by the
EPTI sequence. (b) Temperature distribution map of 8 continuous frames. The 8
frames are evenly selected within the 5 minutes of acquisition time. (c) The
standard deviation curve for the temperature distribution over the entire brain.