1Department of Radiology, University of Pennsylvania, Philadelphia, PA, United States, 2Pancreatic Cancer Research Center, University of Pennsylvania, Philadelphia, PA, United States, 3Abramson Cancer Center, University of Pennsylvania, Philadelphia, PA, United States
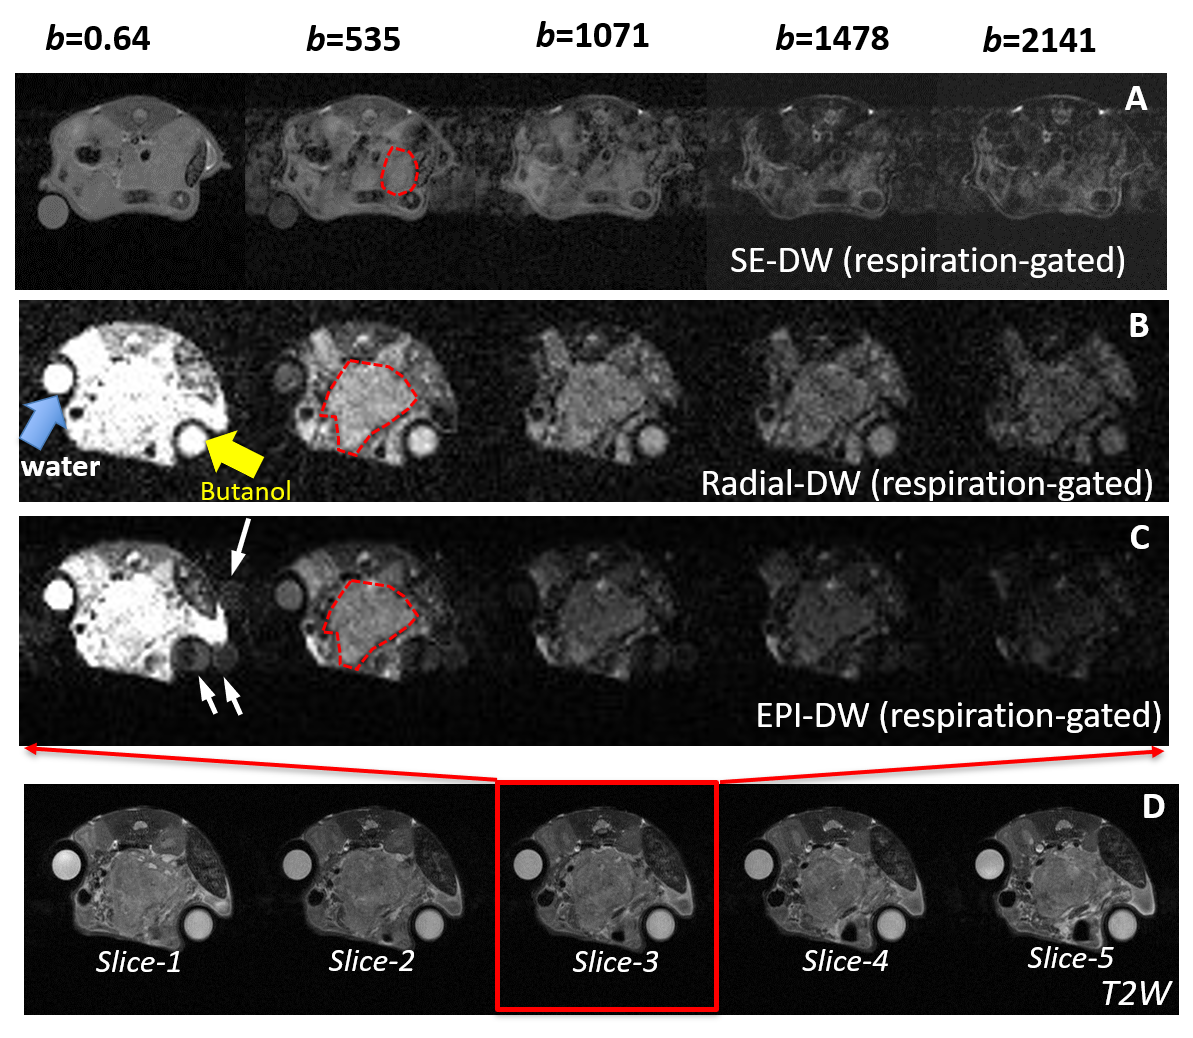
Figure 1 Comparison of Radial- vs. EPI-DW for motion suppression and ghosting.
DW-MR images obtained from respiration-gated SE- (A), Radial- (B) and EPI-DW (C) protocol using indicated b-values. White arrows in A point to motion artifacts at b=500 and above and to ghosting artefacts in EPI-DW images (C). Red frame and arrows in D indicate that of the five T2W images, slide-3 corresponds to DW-images displayed in B and C with different b-values. DW-images in A are from a different mouse.
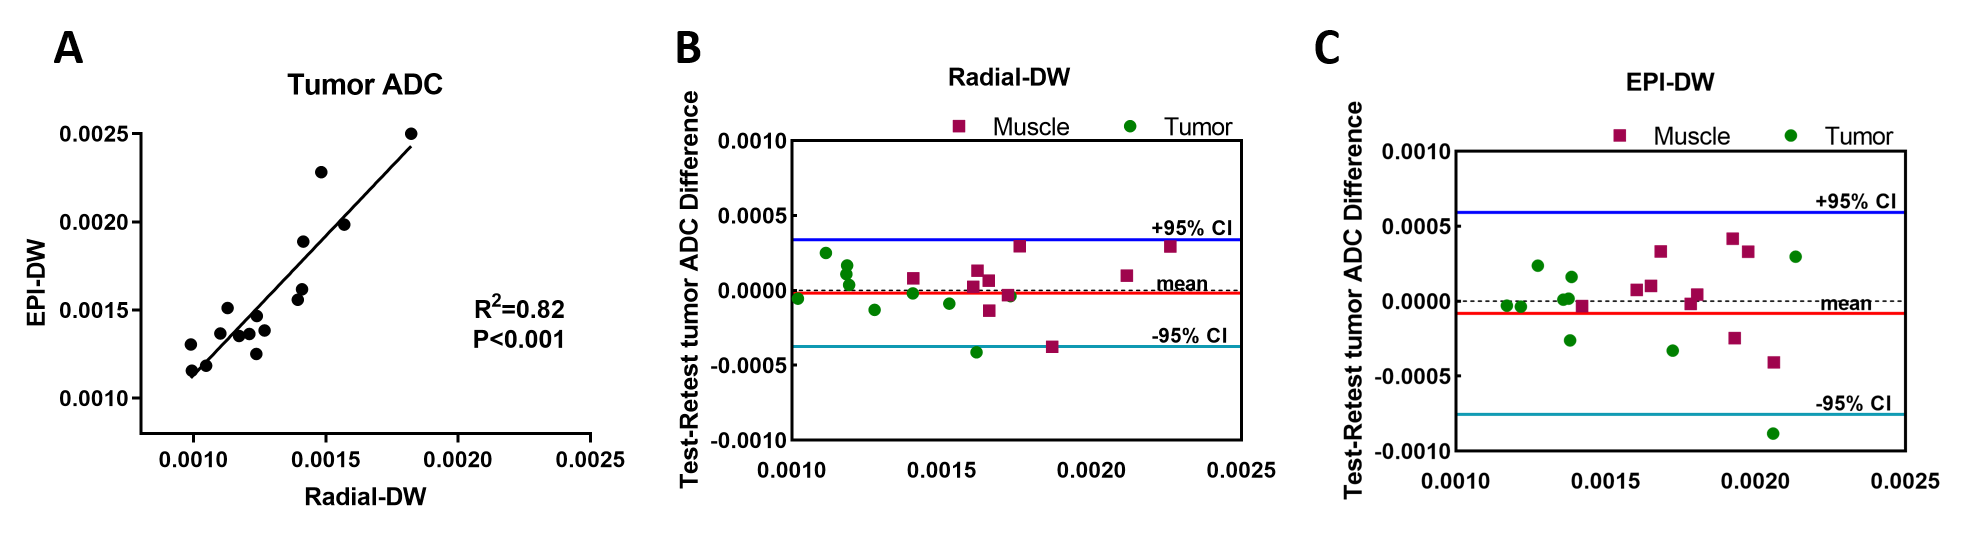
Figure 3 Correlation and test-retest ADC values in tumor and muscle in comparison of radial vs. EPI DW-MRI Protocol
The tumor ADC values measured from Radial- and EPI-DW are highly correlated (A) (r2=0.82). Bland-Altman plots of tumor and muscle ADC value between test and retest data were shown for Radial-DW (B) and EPI-DW (C) protocol. More details in Table 1.