Carole Hélène Sudre1,2, Chiara Maffei3, Josephine Barnes2, David Thomas2, David Cash2, Tom Parker2, Chris Lane2, Marcus Richards2, Hui Zhang2, Sebastien Ourselin1, Jonathan Schott2, Anastasia Yendiki3, and M. Jorge Cardoso1
1King's College London, London, United Kingdom, 2University College London, London, United Kingdom, 3Massachusetts General Hospital, Boston, MA, United States
1King's College London, London, United Kingdom, 2University College London, London, United Kingdom, 3Massachusetts General Hospital, Boston, MA, United States
Diffusion metrics extracted from multishell acquisition
correlate strongly with white matter hyperintensities along reconstructed tracts.
Changes to the diffusion signal are consistently observable in the direct
vicinity of lesions.
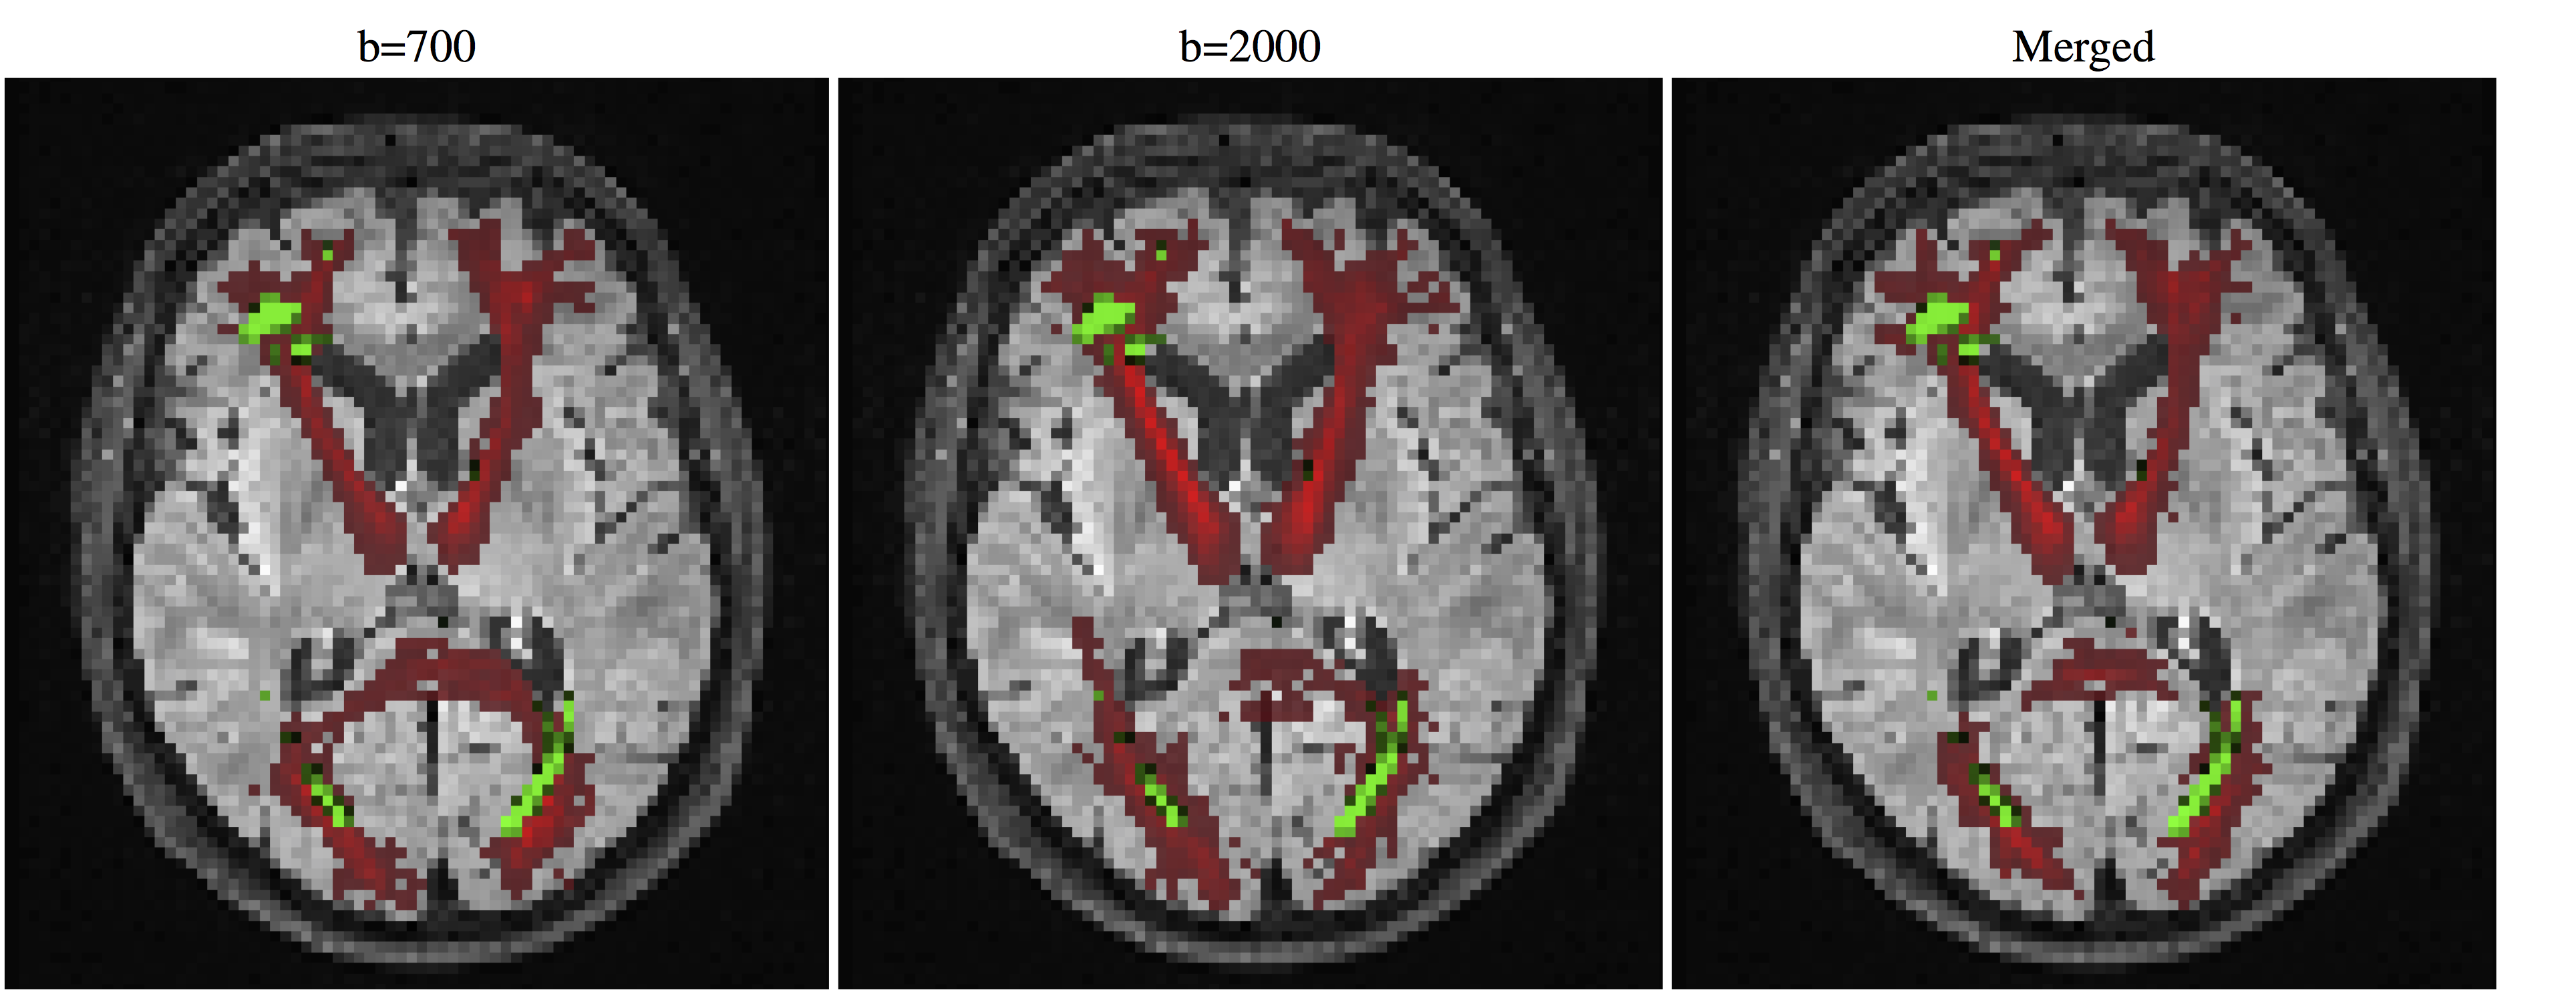
Figure 1
Lesion (green) and
probability (red) maps of selected (Anterior thalamic radiation and forceps
major) reconstructed tracts overlaid on a FLAIR image for the three
tractography configurations: using b=700, b=2000 or both.
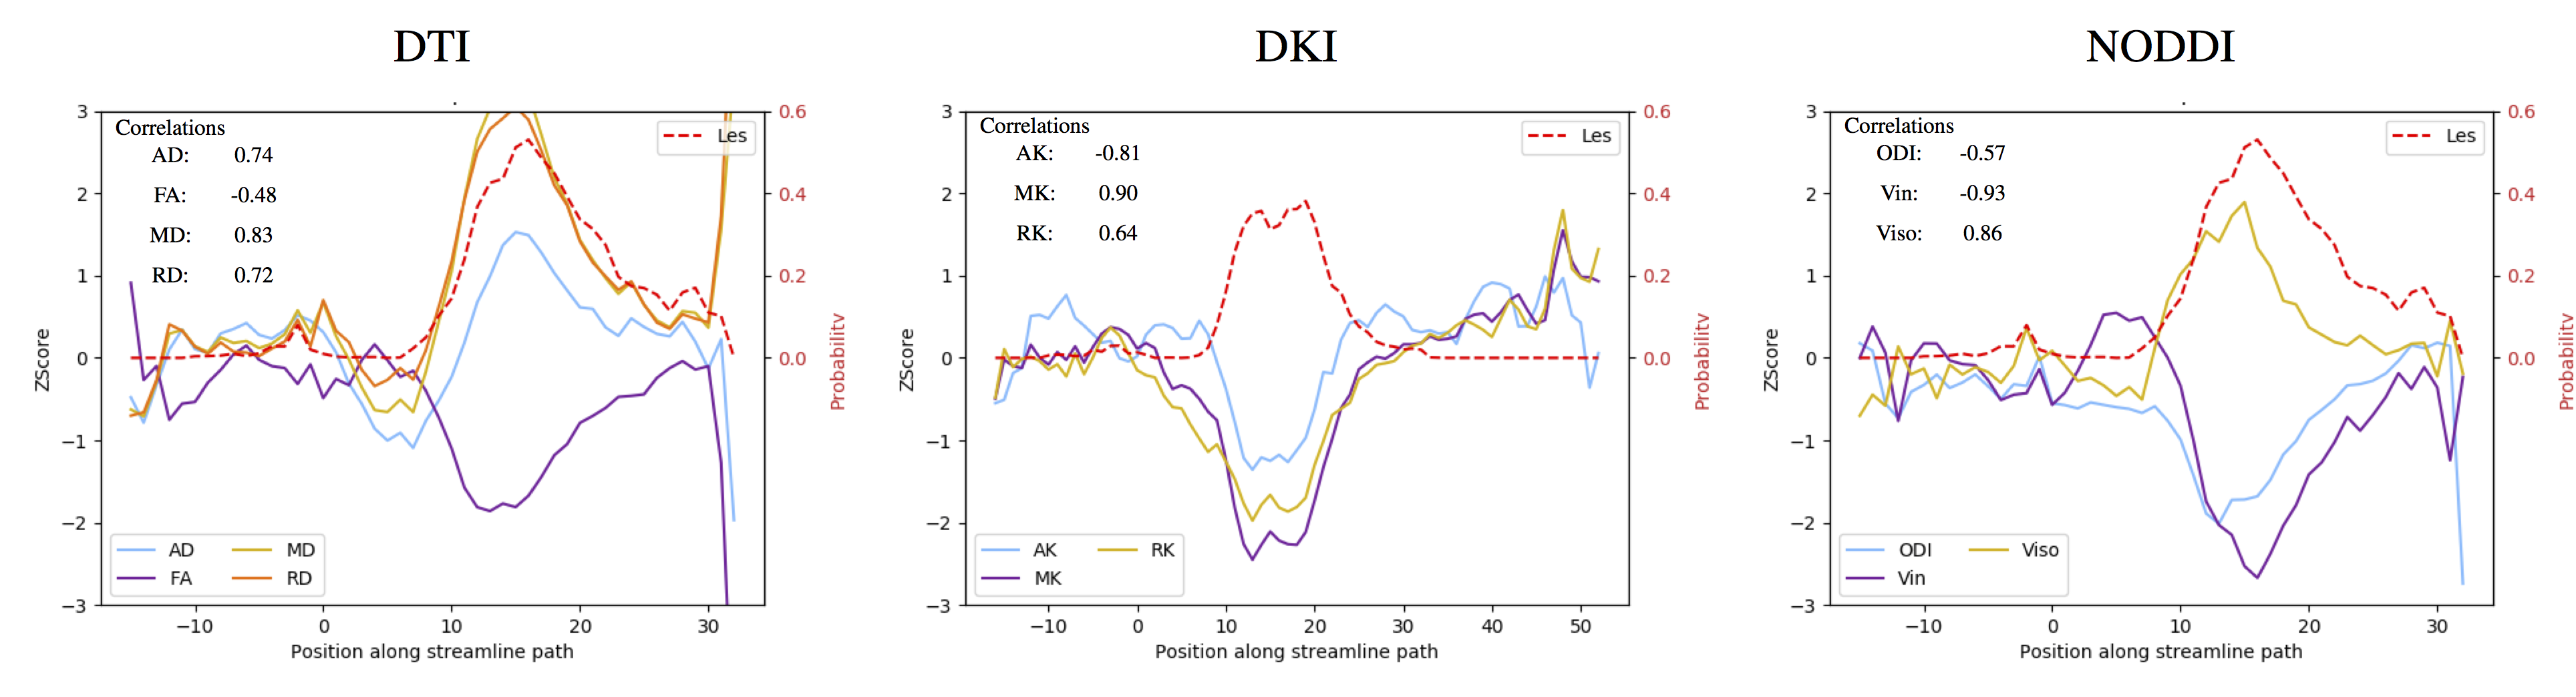
Figure 2 Example of diffusion metrics Z-Score (left axis) and lesion average probability (right axis) profile along a specific tract for DTI, DKI and NODDI measures. Position 0
indicates the centre of mass of the tract probabilistic map. Pearson
correlations are indicated for each plotted metric