Timo Roine1,2, Oskari Kantonen3, Jaakko Langsjö3,4, Kimmo Kaskinoro5, Roosa Kallionpää2,5,6, Annalotta Scheinin3,5, Katja Valli2,5,6,7, Timo Laitio5, Antti Revonsuo2,6,7, and Harry Scheinin3,5,8
1Department of Neuroscience and Biomedical Engineering, Aalto University School of Science, Espoo, Finland, 2Turku Brain and Mind Center, University of Turku, Turku, Finland, 3Turku PET Centre, University of Turku and the Hospital District of Southwest Finland, Turku, Finland, 4Department of Intensive Care, Tampere University Hospital, Tampere, Finland, 5Division of Perioperative Services, Intensive Care and Pain Medicine, Turku University Hospital, University of Turku, Turku, Finland, 6Department of Psychology and Speech-Language Pathology, University of Turku, Turku, Finland, 7Department of Cognitive Neuroscience and Philosophy, School of Bioscience, University of Skövde, Skövde, Sweden, 8Department of Pharmacology, Drug Development and Therapeutics, University of Turku, Turku, Finland
1Department of Neuroscience and Biomedical Engineering, Aalto University School of Science, Espoo, Finland, 2Turku Brain and Mind Center, University of Turku, Turku, Finland, 3Turku PET Centre, University of Turku and the Hospital District of Southwest Finland, Turku, Finland, 4Department of Intensive Care, Tampere University Hospital, Tampere, Finland, 5Division of Perioperative Services, Intensive Care and Pain Medicine, Turku University Hospital, University of Turku, Turku, Finland, 6Department of Psychology and Speech-Language Pathology, University of Turku, Turku, Finland, 7Department of Cognitive Neuroscience and Philosophy, School of Bioscience, University of Skövde, Skövde, Sweden, 8Department of Pharmacology, Drug Development and Therapeutics, University of Turku, Turku, Finland
We used diffusion MRI to investigate brain
microstructure and structural connectivity in
dexmedetomidine-induced loss of consciousness. We found rapid local changes most
prominent in the left angular gyrus and its connections by using both methods.
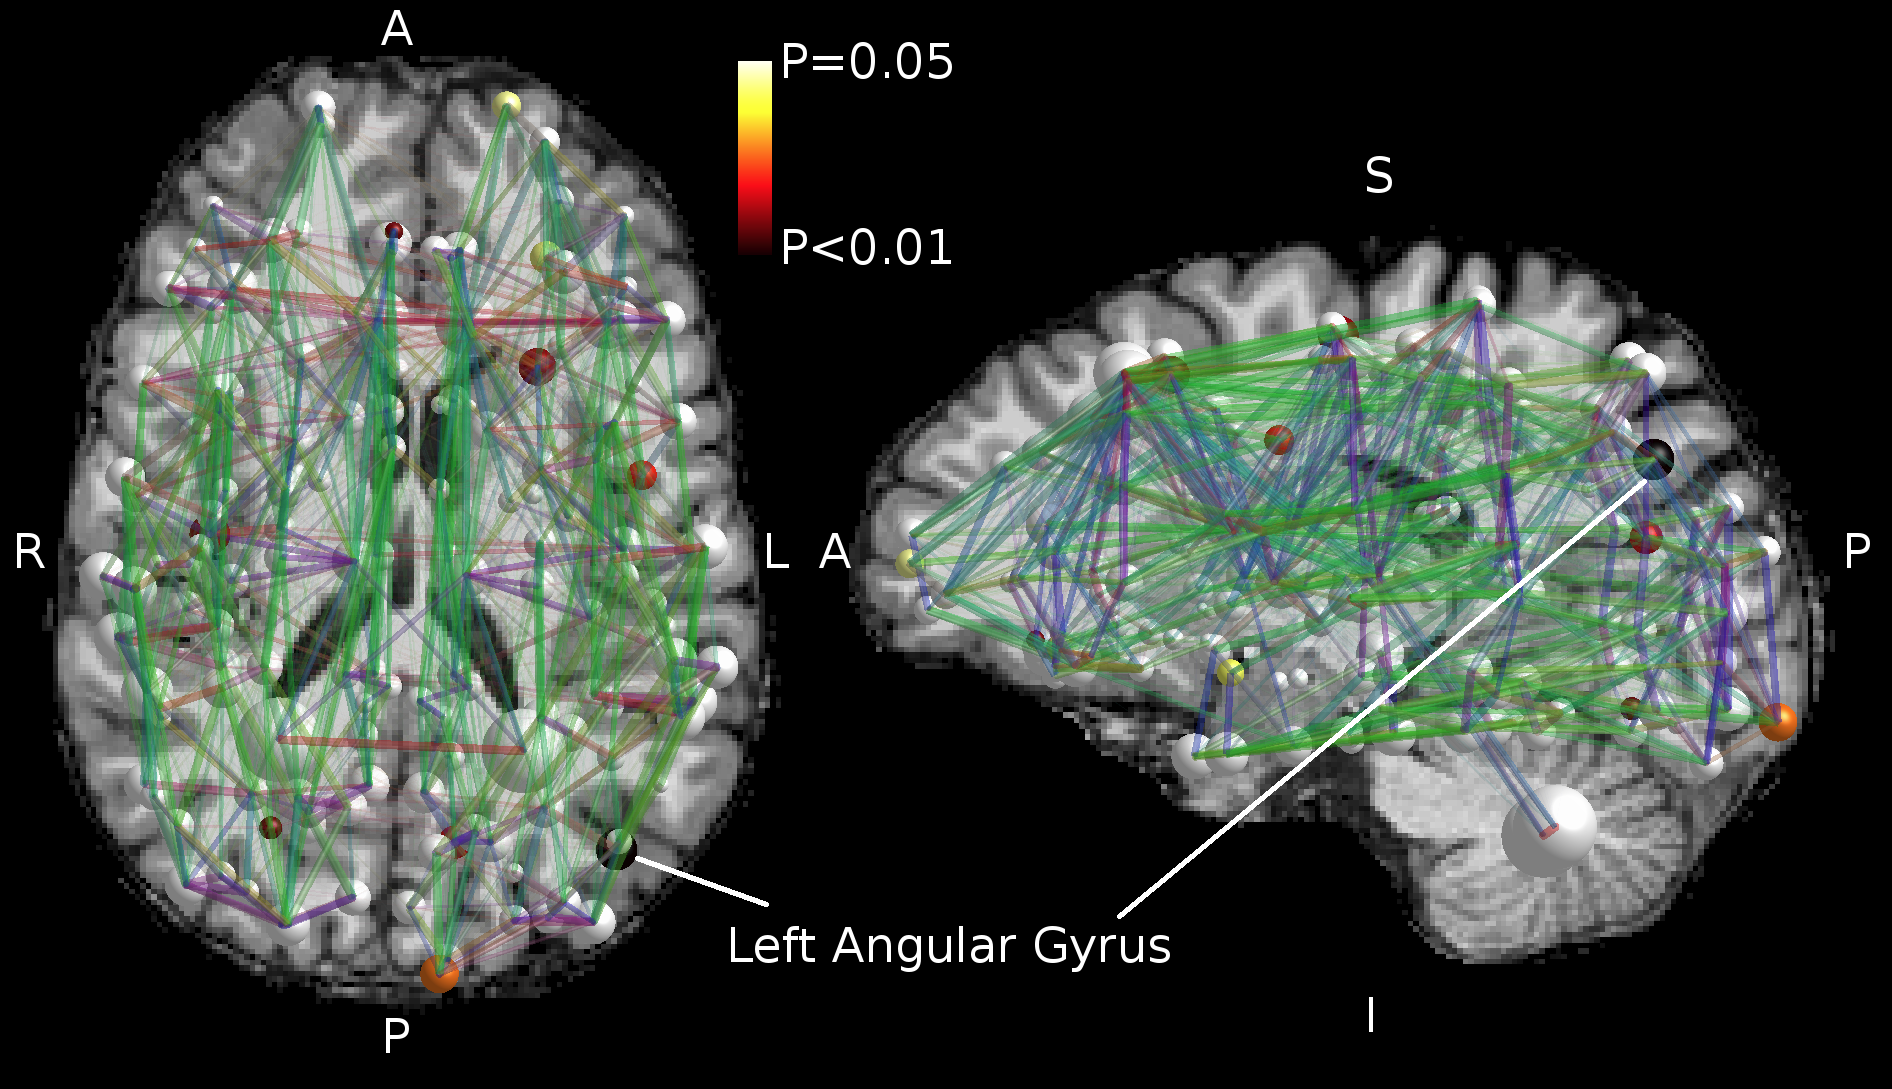
Figure 3. Local alterations in betweenness
centrality of the structural brain connectivity networks. Statistical
significance is illustrated by the color of the node from white (not
significant) via yellow and red to black (most significant) as shown by the
color bar. The size of the node reflects the volume of the gray matter area. The
color of the edges corresponds to the direction – red: left (L)-right (R),
blue: inferior (I)-superior (S), green: anterior (A)-posterior (P) The
betweenness centrality of the left angular gyrus was significantly
decreased (P=0.00027).
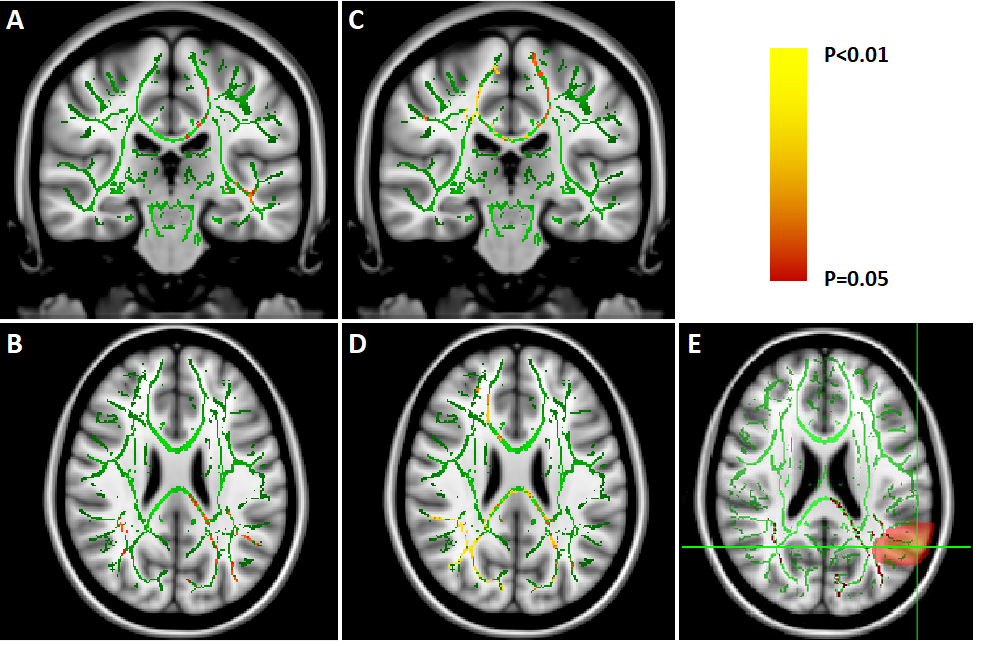
Figure 2. Local microstructural differences in mean diffusivity (A, B,
E) and axial diffusivity (C, D). In Fig. 2E the location of the left angular
gyrus is highlighted. The color scale from red to yellow describes the
statistical significance of the decrease in the microstructural metric in the
loss of consciousness (LOC) state compared to awake state. The white matter
skeleton is visualized in green. The images are presented in radiological
convention (left hemisphere on the right and vice versa).