Jeff A Stainsby1, Chad T Harris1, Andrew T Curtis1, Philip J Beatty1, and Curtis N Wiens1
1Synaptive Medical, Toronto, ON, Canada
1Synaptive Medical, Toronto, ON, Canada
We demonstrate
the feasibility of diffusion tractography from a 0.5T system and compare
results qualitatively to tractography obtained from a clinical 1.5T scanner and
quantitatively to literature values.
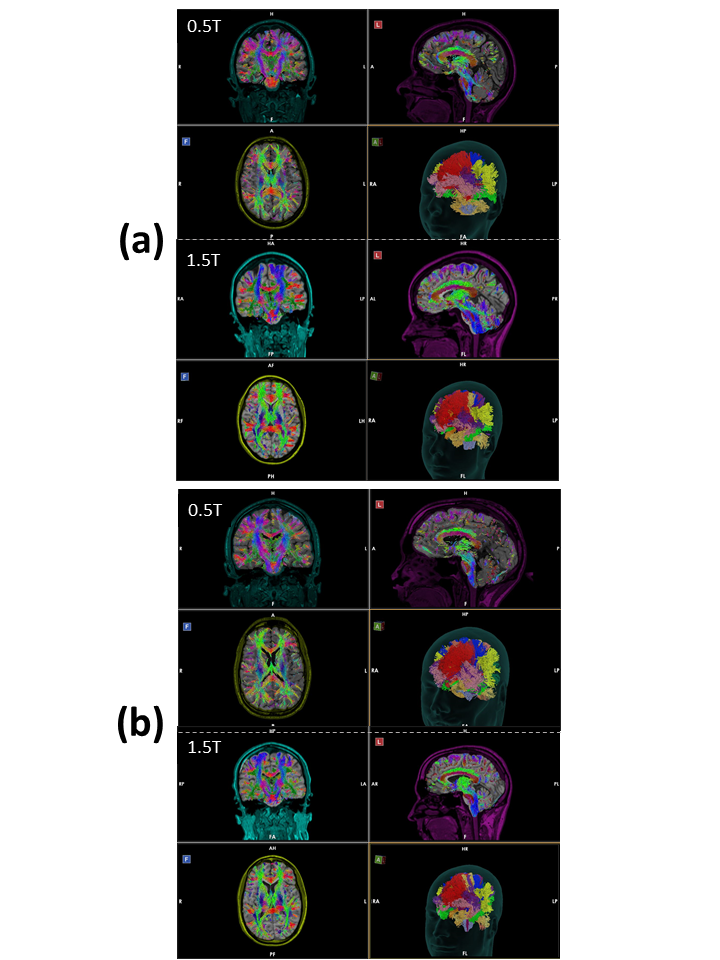
Figure 2: (a)
Representative whole brain tractography demonstrated in 3 orthogonal imaging
planes and whole brain automatic white matter segmentation results from volunteer
#1 obtained at 0.5T (top) and 1.5T (bottom). (b) Analogous tractography images
obtained from volunteer #2.
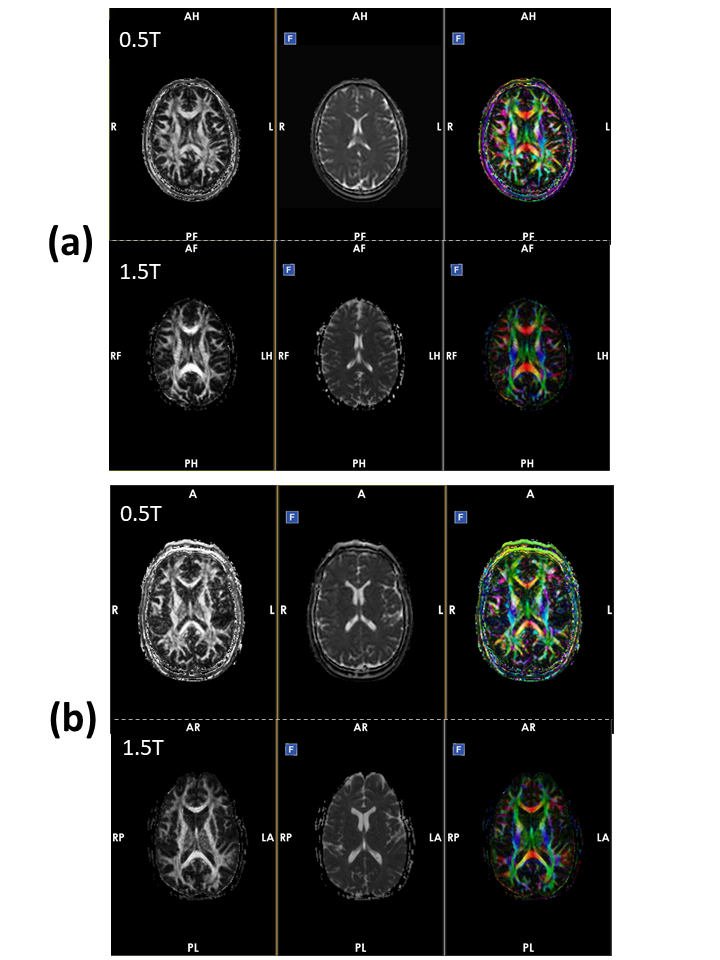
Figure 1: (a)
Representative processed FA (left), ADC (middle), and RGB (right) images from volunteer
#1 obtained at 0.5T (top) and 1.5T (bottom). (b) Analogous images from volunteer #2.