Bing Liu1,2, Xiangtao Lin1,2, Peng Zhao1, Xianshun Yuan1,2, Mengxiao Liu3, Xiang Feng4, Lei Xue5, Mimi Tian2, Shuai Zhang1,2, Dejuan Shan1,2, and Xiaoli Li1,2
1Department of Radiology, Shandong Provincial Hospital Affiliated to Shandong University, Jinan, China, 2Shandong University, Jinan, China, 3MR Scientific Marketing, Diagnostic Imaging, Siemens Healthcare Ltd, Shanghai, China, 4MR Scientific Marketing, Diagnostic Imaging, Siemens Healthcare Ltd, Beijing, China, 5MR Application, Siemens Healthcare Ltd, Jinan, China
1Department of Radiology, Shandong Provincial Hospital Affiliated to Shandong University, Jinan, China, 2Shandong University, Jinan, China, 3MR Scientific Marketing, Diagnostic Imaging, Siemens Healthcare Ltd, Shanghai, China, 4MR Scientific Marketing, Diagnostic Imaging, Siemens Healthcare Ltd, Beijing, China, 5MR Application, Siemens Healthcare Ltd, Jinan, China
D* in IVIM, MK in DKI and ADC in DWI were superior than other diffusion parameters (D, F in IVIM, MD in DKI) in accurately locating lesions as well as differentiating between lesions and normal thyroid parenchyma.
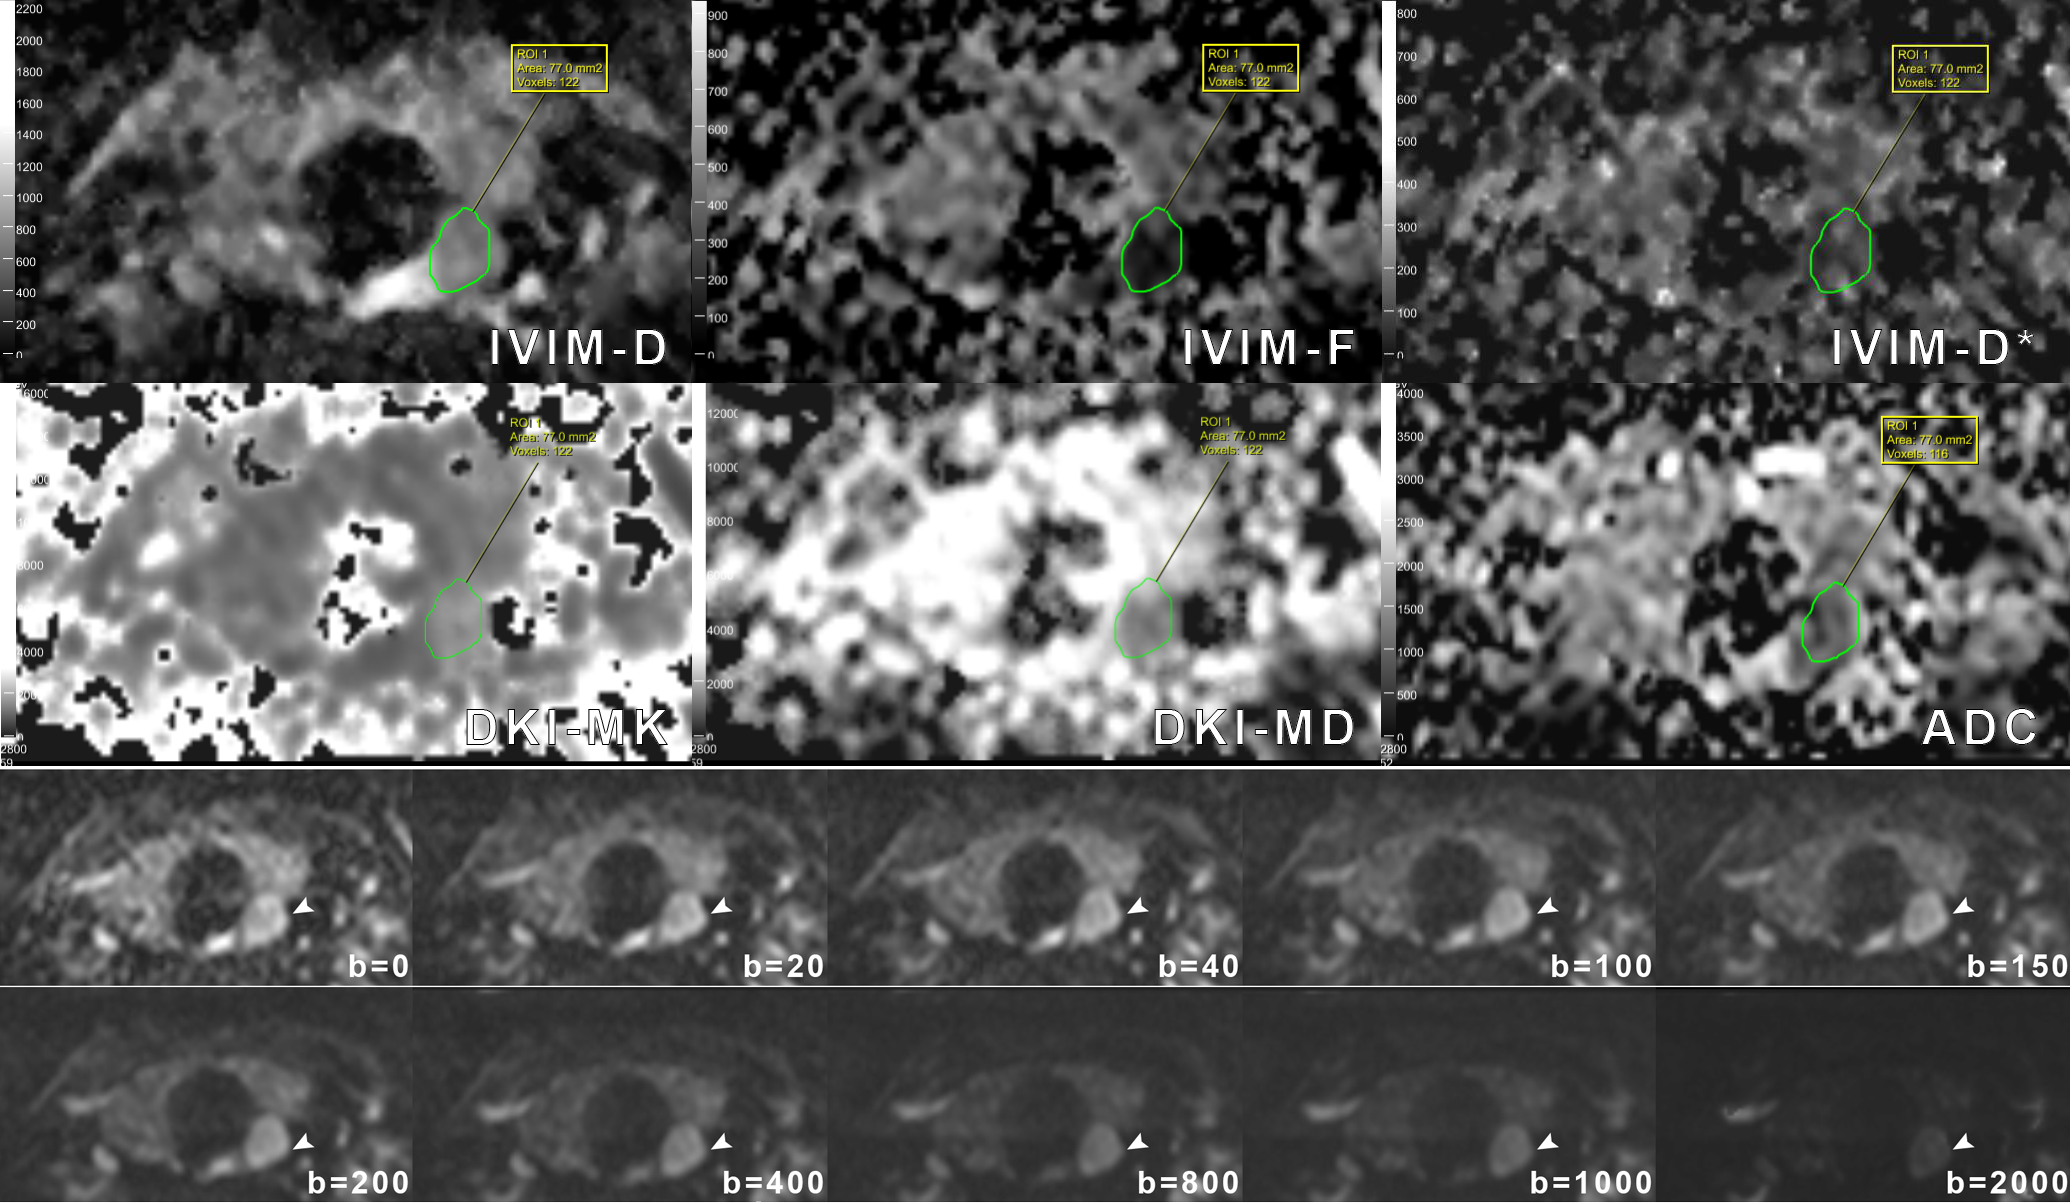
Figure 1: Images of a 65-year-old woman with a parathyroid adenoma (green circles and white arrowheads). The mean values of IVIM-D, IVIM-F, IVIM-D*, DKI-MK, DKI-MD and ADC of the ROIs (green circles) in the lesion were 0.70×10⁻³mm2/s, 16.3%, 9.81×10⁻³mm2/s, 1.60, 1.62×10⁻³mm2/s and 0.95×10⁻³mm2/s. Signal intensity of the lesion (arrowheads) decayed with b-values going up from 0 to 2000 s/mm2.
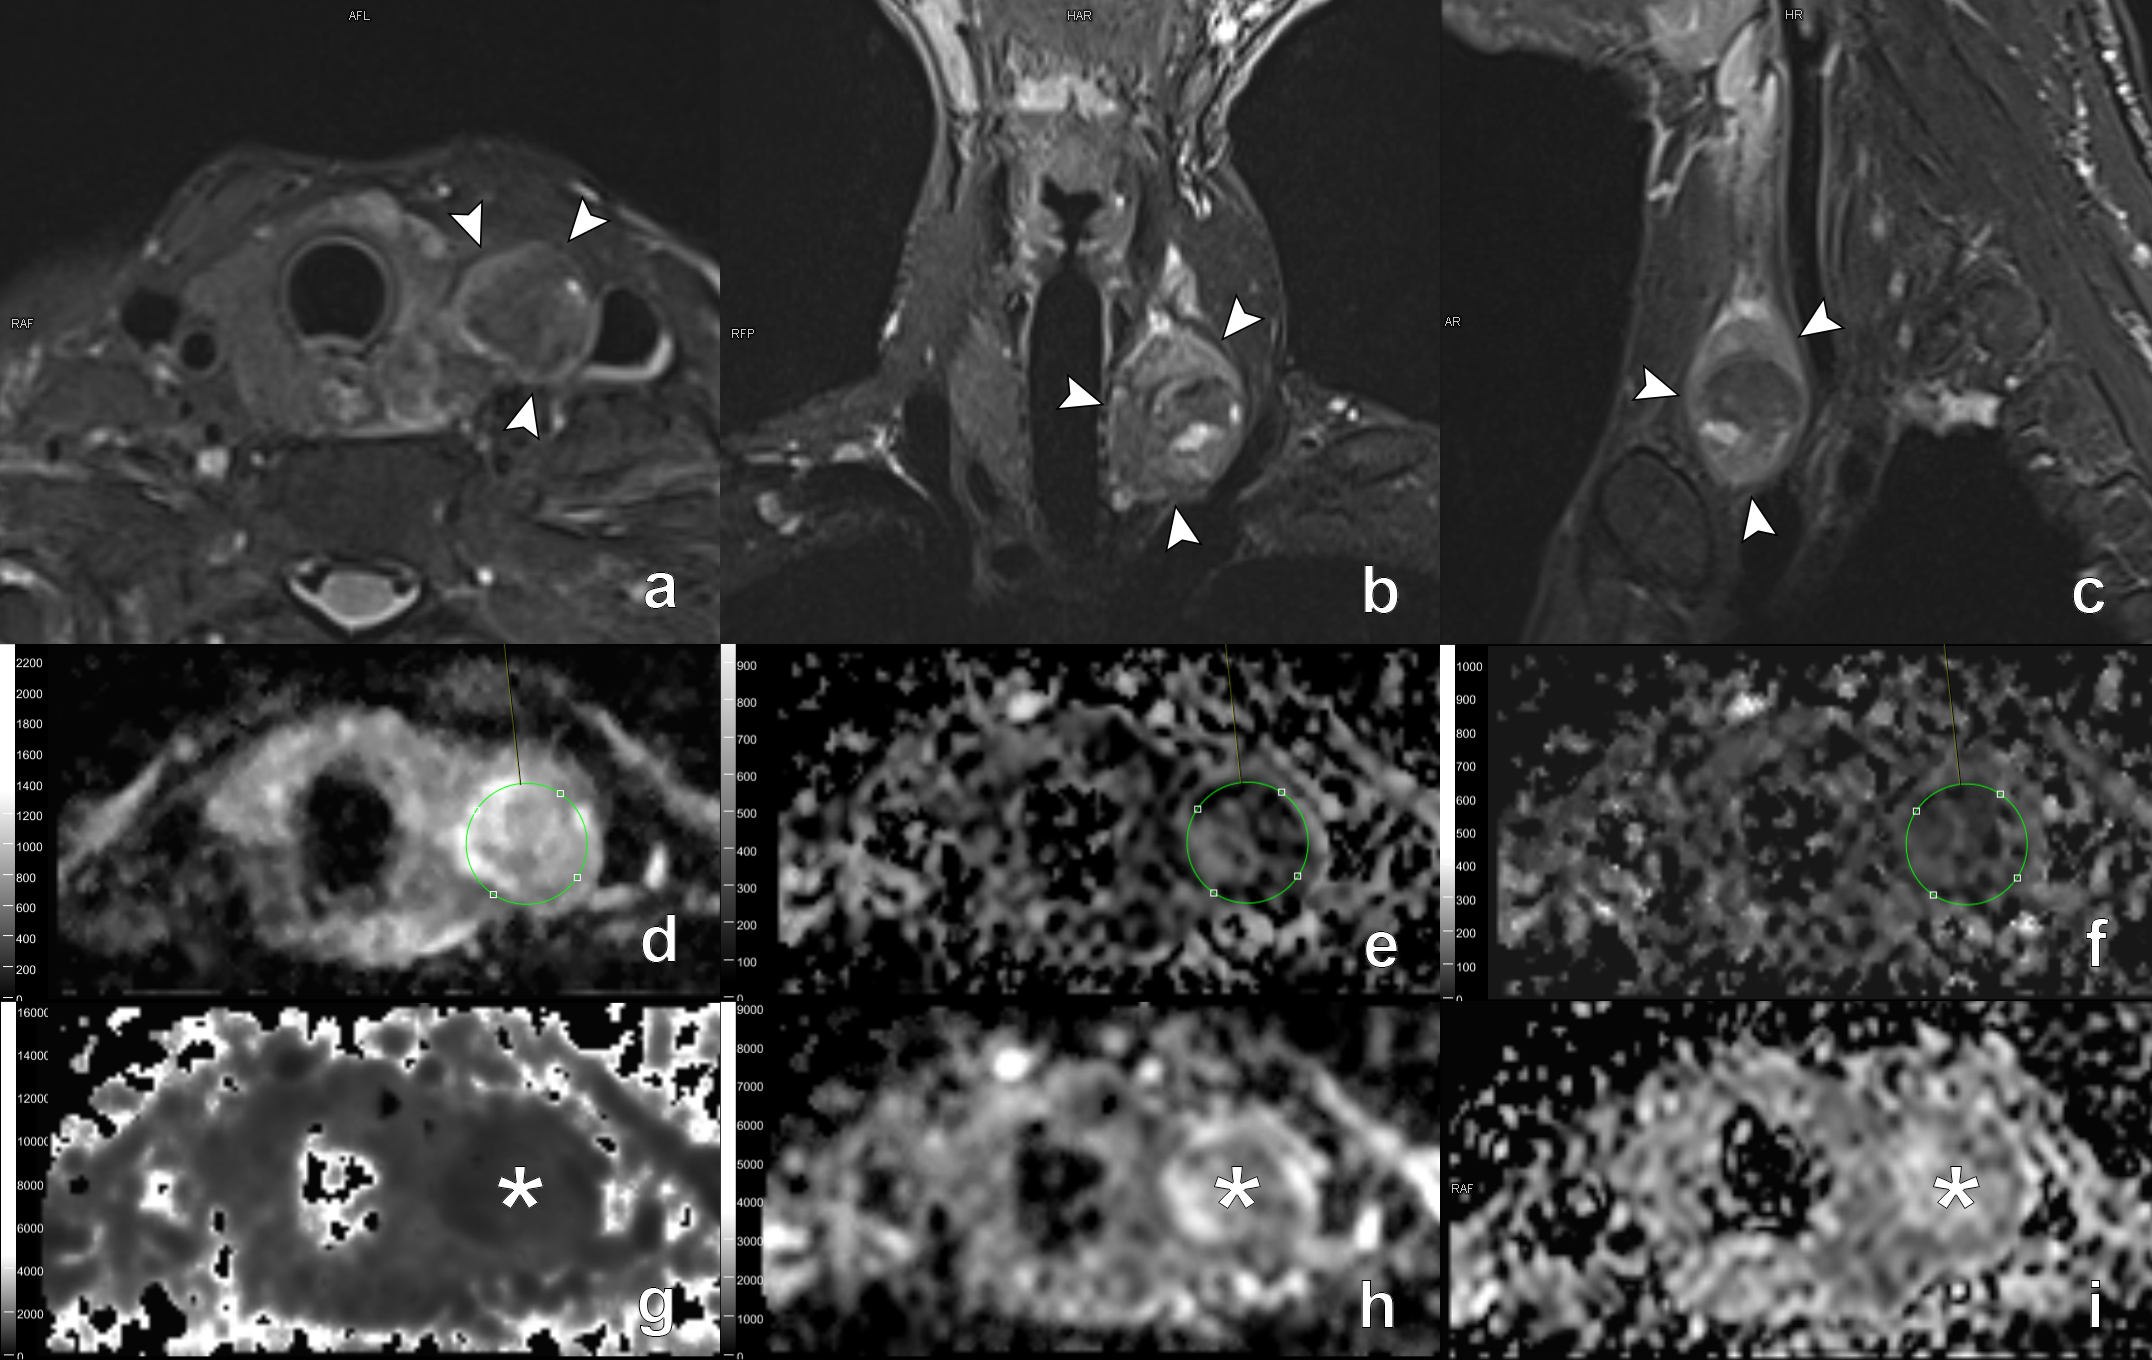
Figure 2: A 72-year-old man with malignant nodule on left thyroid lobe. a-c: fat-suppressed T2-weighted images of the lesion (arrowheads) at the position of axial, coronal and sagittal. d-f: ROIs (green circle) of the lesion shown on IVIM parametric maps (d: D map, e: F map and f: D* map). g-i: DKI parametric maps (g: MK map and h: MD map) and ADC map (i) of the lesion (asterisks). The mean values of D, F, D*, MK, MD and ADC of the malignant lesion were 0.89×10⁻³mm2/s, 26.20%, 7.05×10⁻³mm2/s, 0.87, 2.08×10⁻³mm2/s and 1.19×10⁻³mm2/s, respectively.