Xin Li1, Ryan Kopp2,3, William D Rooney1, Fergus Coakley4, and Mark Garzotto2,3
1Advanced Imaging Research Center, Oregon Health & Science University, Portland, OR, United States, 2Portland VA Medical Center, Portland, OR, United States, 3Urology, Oregon Health & Science University, Portland, OR, United States, 4Diagnostic Radiology, Oregon Health & Science University, Portland, OR, United States
1Advanced Imaging Research Center, Oregon Health & Science University, Portland, OR, United States, 2Portland VA Medical Center, Portland, OR, United States, 3Urology, Oregon Health & Science University, Portland, OR, United States, 4Diagnostic Radiology, Oregon Health & Science University, Portland, OR, United States
A two-step approach that first determines the diffusion constant (D)
then the pseudo-perfusion parameters (D*, f) is used to quantify IVIM
parameters. Results show that the new approach returns more consistency
parametric maps and is favored by AIC.
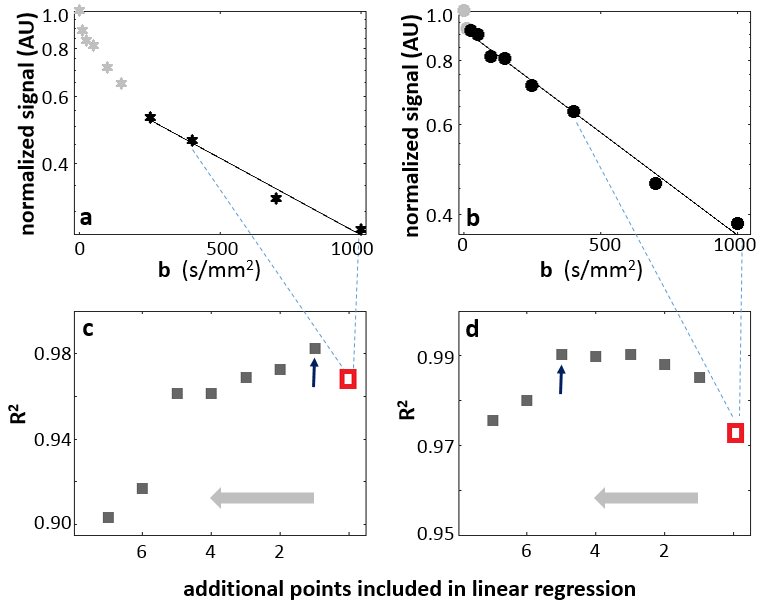
Figure 1. Two single-voxel data sets that resulted in a
narrower (a,c) and a wider (b,d) b-range in D quantification.
Starting with a linear regression of log(S/S0) vs. b for b-values
within 400-1000 s/mm2, the R2
(red symbols in c, d) were
calculated. Each subsequent linear-regression fitting involved an additional
data point from the previous DWI frame (smaller b value). a,b: demarcate “optimal range” as black symbols with
linear-regression lines. c,d:
show R2 plot against addition b points (abscissa direction: right to left). The maximum R2 values are
indicated with blue arrows.
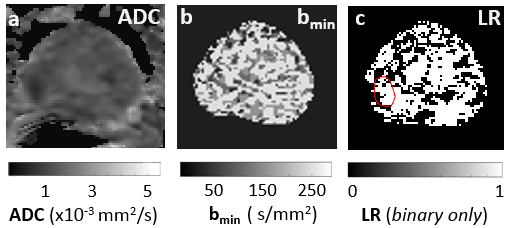
Figure 2. a: ADC map
from one subject. b: bmin map determined
using the R2 approach. c:
a binary map for pixels with AIC model selection favoring the two-step modeling
approach. The lesion ROI is indicated in red.