Isaac Vicente Manzanera Esteve1, Angel F Farinas1, Alonda C Pollins1, Wesley P Thayer1, Mark Does1, and Richard Dortch1
1VUIIS, Vanderbilt University Medical Center, Nashville, TN, United States
1VUIIS, Vanderbilt University Medical Center, Nashville, TN, United States
High-resolution DTI of ex vivo rat sciatic nerve yields FA values decreased with increasing cut depth at 4 weeks. By week 12, the three partial cuts showed elongated FA distributions, most likely representing regions with regenerated (high FA values) and degenerated axons (low FA values).
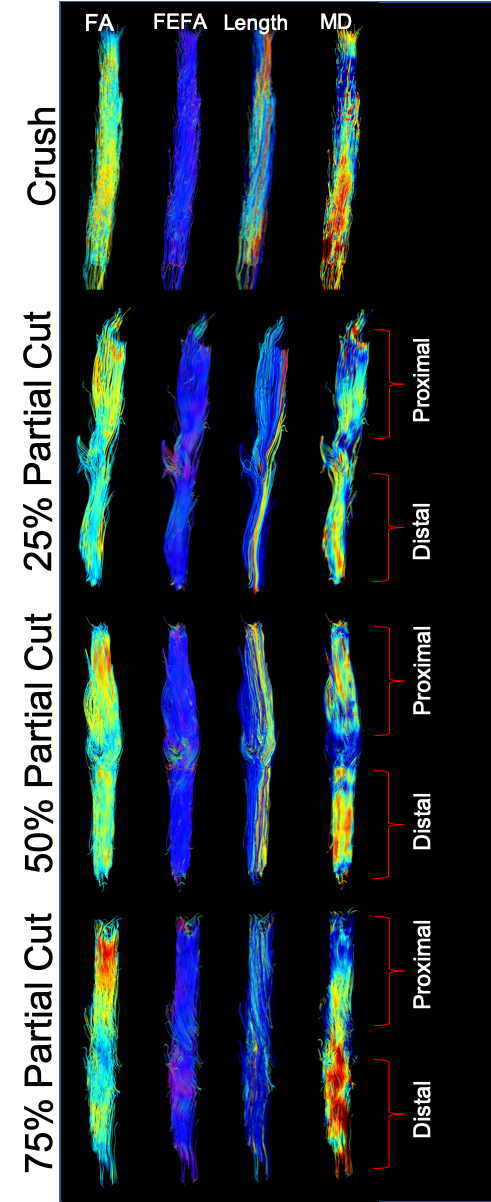
Representative tractography from crush and partial cuts nerve (25%, 50% and 75%). Color-coded tracks of FA, FEFA (V1*FA), track length and MD shown.
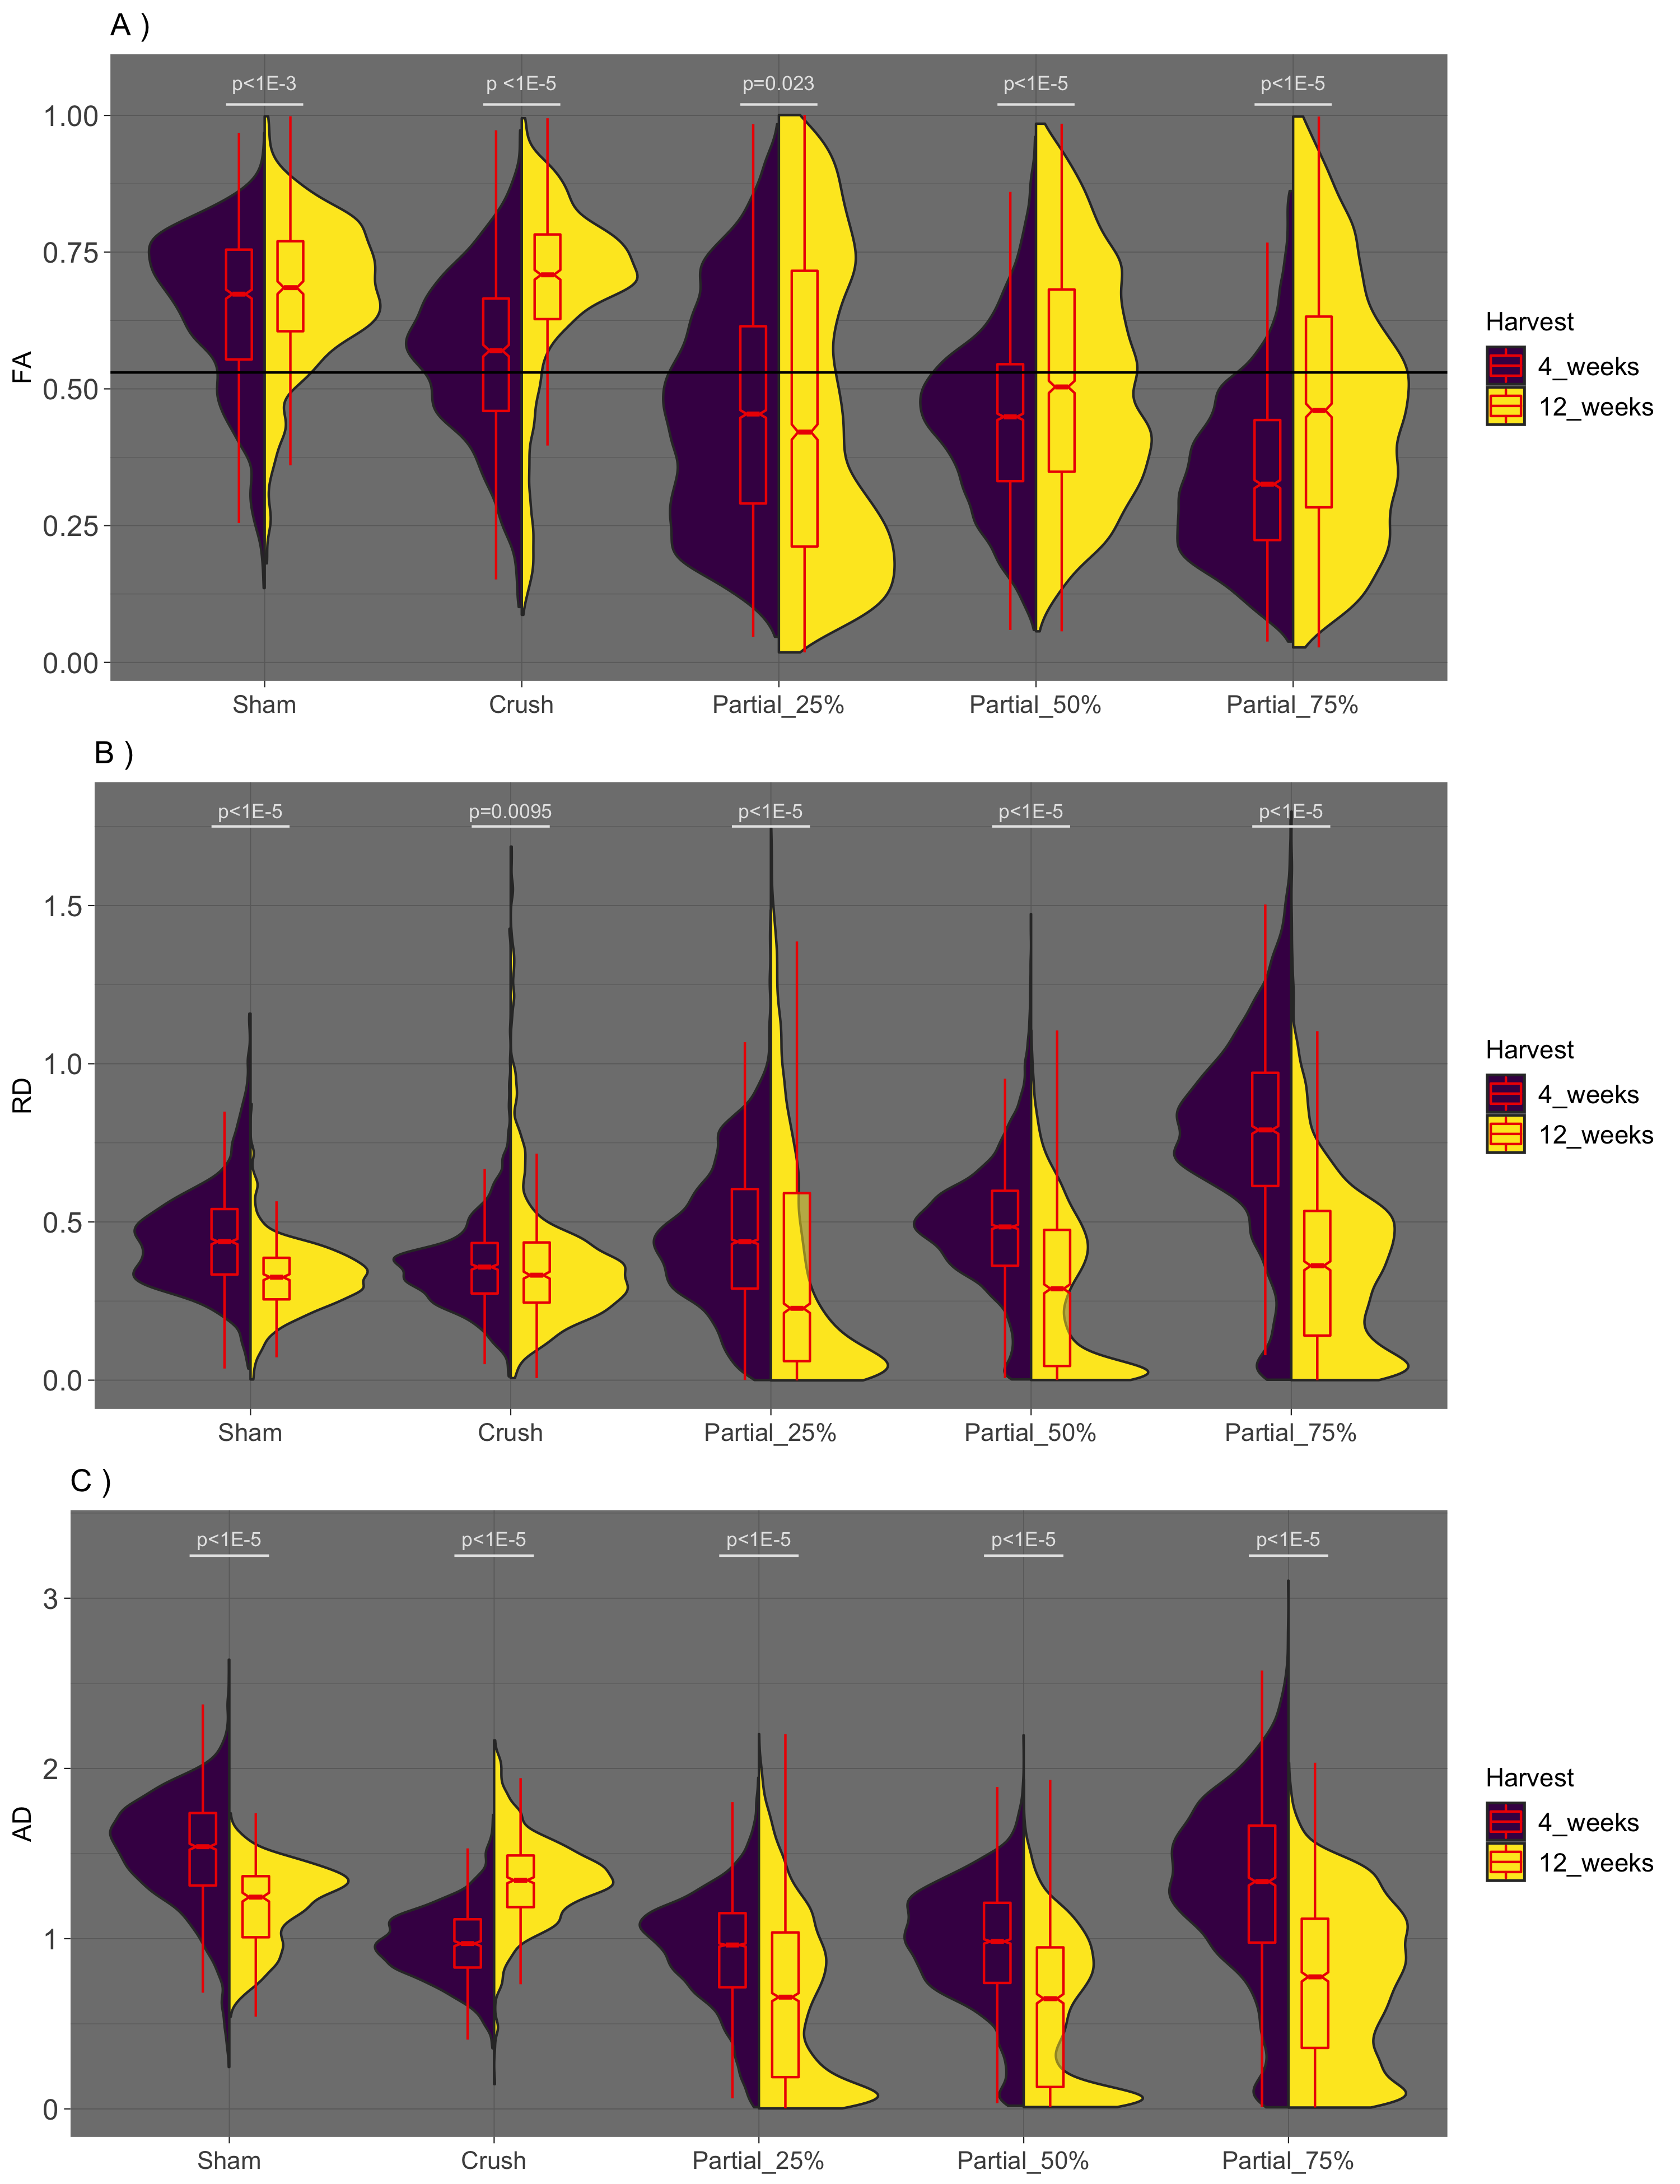
Split violin plots of A) FA, B) RD, C) AD for sham, crush, and partial cuts nerves at 4 (left, purple) and 12 weeks (right, yellow). Boxplots for each cohort/time are given in red for comparison along with the p-values for Wilcoxon rank-sum tests between 4 and 12 weeks. Note that while significant differences were observed for all cohort/indices across the two times, this does not tell the complete story given the heterogeneous recovery observed in the partial cut samples at 12 weeks (broad distributions shown in the violin plots).