Xianfu Luo1, Jing Ye1, Weiqiang Dou2, Jun Sun1, and Wei Xia1
1Radiology, Clinical Medical School of Yangzhou University, Northern Jiangsu People’s Hospital, Yangzhou, China, 2GE Healthcare,MR Research China, Beijing, China
1Radiology, Clinical Medical School of Yangzhou University, Northern Jiangsu People’s Hospital, Yangzhou, China, 2GE Healthcare,MR Research China, Beijing, China
Stretched-exponential DWI
performed as well as bi-exponential DWI and better than mono-exponential DWI in
the noninvasive characterization of NAFLD severity.
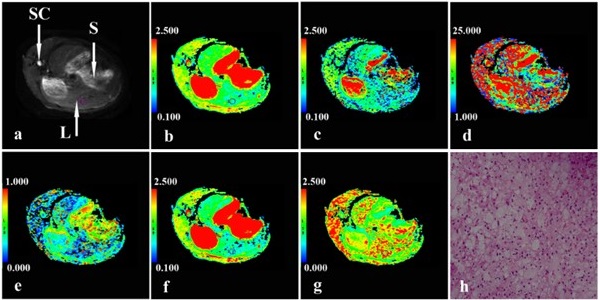
Fig. 2 A rabbit with a high-fat/cholesterol diet feeding for 8 weeks. (a) axial imaging with b value of 0 s/mm2, ADC, D, D*, f, DDC and α pseudo-color maps (b-g) from monoexponential, biexponential ,and stretched-exponential DWI models were 1.002×10⁻³mm2/s, 0.812×10⁻³mm2/s, 13.731×10⁻³mm2/s, 29.102%, 0.763×10⁻³mm2/s, 0.859, respectively. Histological specimen (h) (magnification, ×200). S=stomach, L=liver, SC=spinal canal.
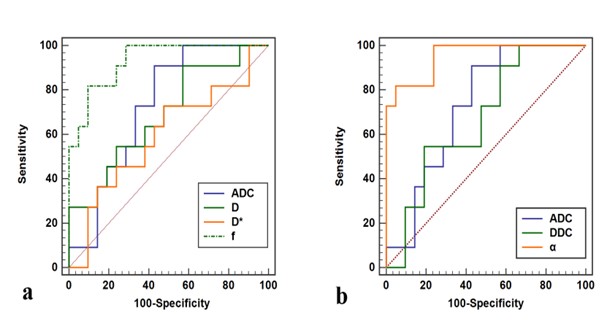
Fig.3 Compare receiver operating characteristic curve for (a) bi-exponential vs. mono-exponential model; (b) stretched-exponential vs. mono-exponential model in distinguishing NASH from borderline or less severity group.