Zhibo Zhu1, Jay Acharya2, Yannick Bliesener1, R. Marc Lebel3,4, Richard Frayne3,5, and Krishna S. Nayak1,2
1Ming Hsieh Department of Electrical and Computer Engineering, University of Southern California, Los Angeles, CA, United States, 2Department of Radiology, University of Southern California, Los Angeles, CA, United States, 3Radiology and Clinical Neuroscience, Hotchkiss Brain Institute, University of Calgary, Calgray, AB, Canada, 4Global MR Applications & Workflow, GE Healthcare, Calgary, AB, Canada, 5Seaman Family MR Research Centre, Foothills Medical Centre, Calgary, AB, Canada
1Ming Hsieh Department of Electrical and Computer Engineering, University of Southern California, Los Angeles, CA, United States, 2Department of Radiology, University of Southern California, Los Angeles, CA, United States, 3Radiology and Clinical Neuroscience, Hotchkiss Brain Institute, University of Calgary, Calgray, AB, Canada, 4Global MR Applications & Workflow, GE Healthcare, Calgary, AB, Canada, 5Seaman Family MR Research Centre, Foothills Medical Centre, Calgary, AB, Canada
We evaluated a novel millimeter resolution whole-brain T1
mapping method in patient with high-grade glioma. Glioma T1 value is
found to be larger and more heterogeneous compared to normal appearing white
matter.
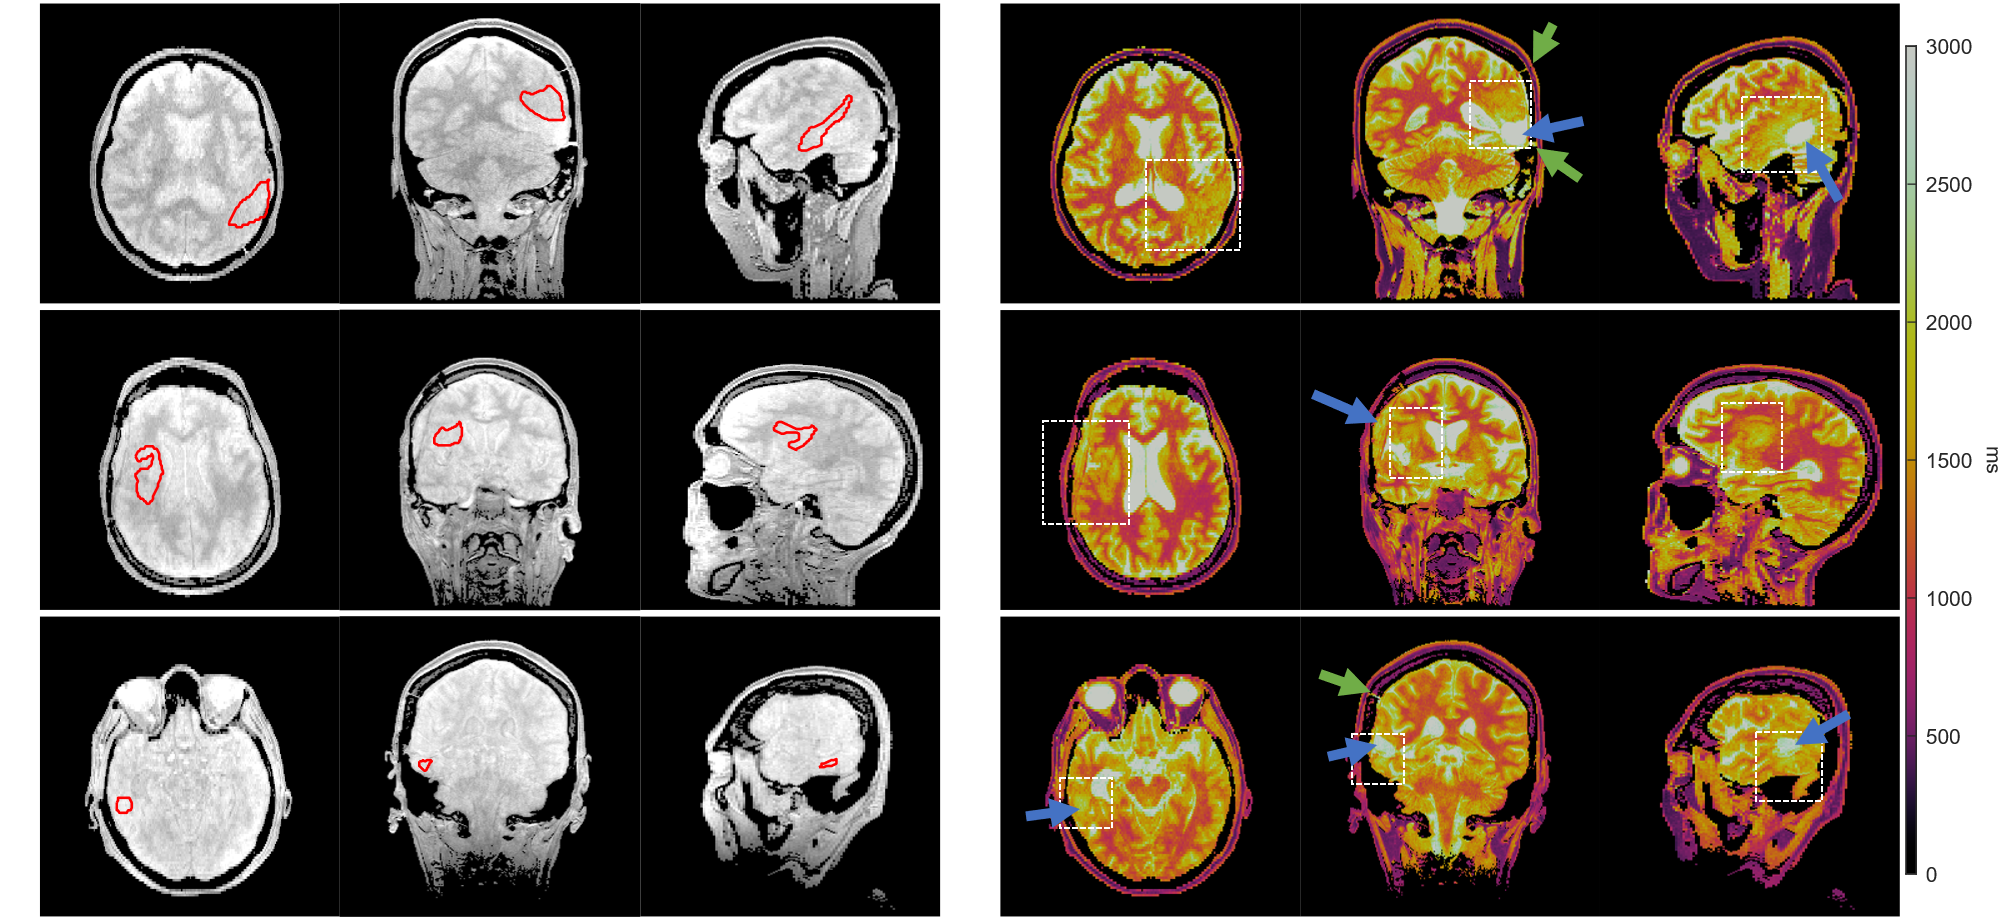
Figure 1: M0 (left) and T1
(right) maps for three representative patients (F71, F61, F67) at the first
time point. Maps
are volumetric, and axial, coronal, and sagittal slices centered on the tumor
section are shown. Tumor ROIs are delineated by red contours on M0 maps. Longer
T1 can be observed in corresponding regions on the T1
maps. In addition, T1 maps reveal the locations of surgical cavities
and extra-axial fluid collection (blue arrows) and evidence of craniotomy
(green arrows). White dashed-line boxes indicate the zoomed-in region in Figure 2.
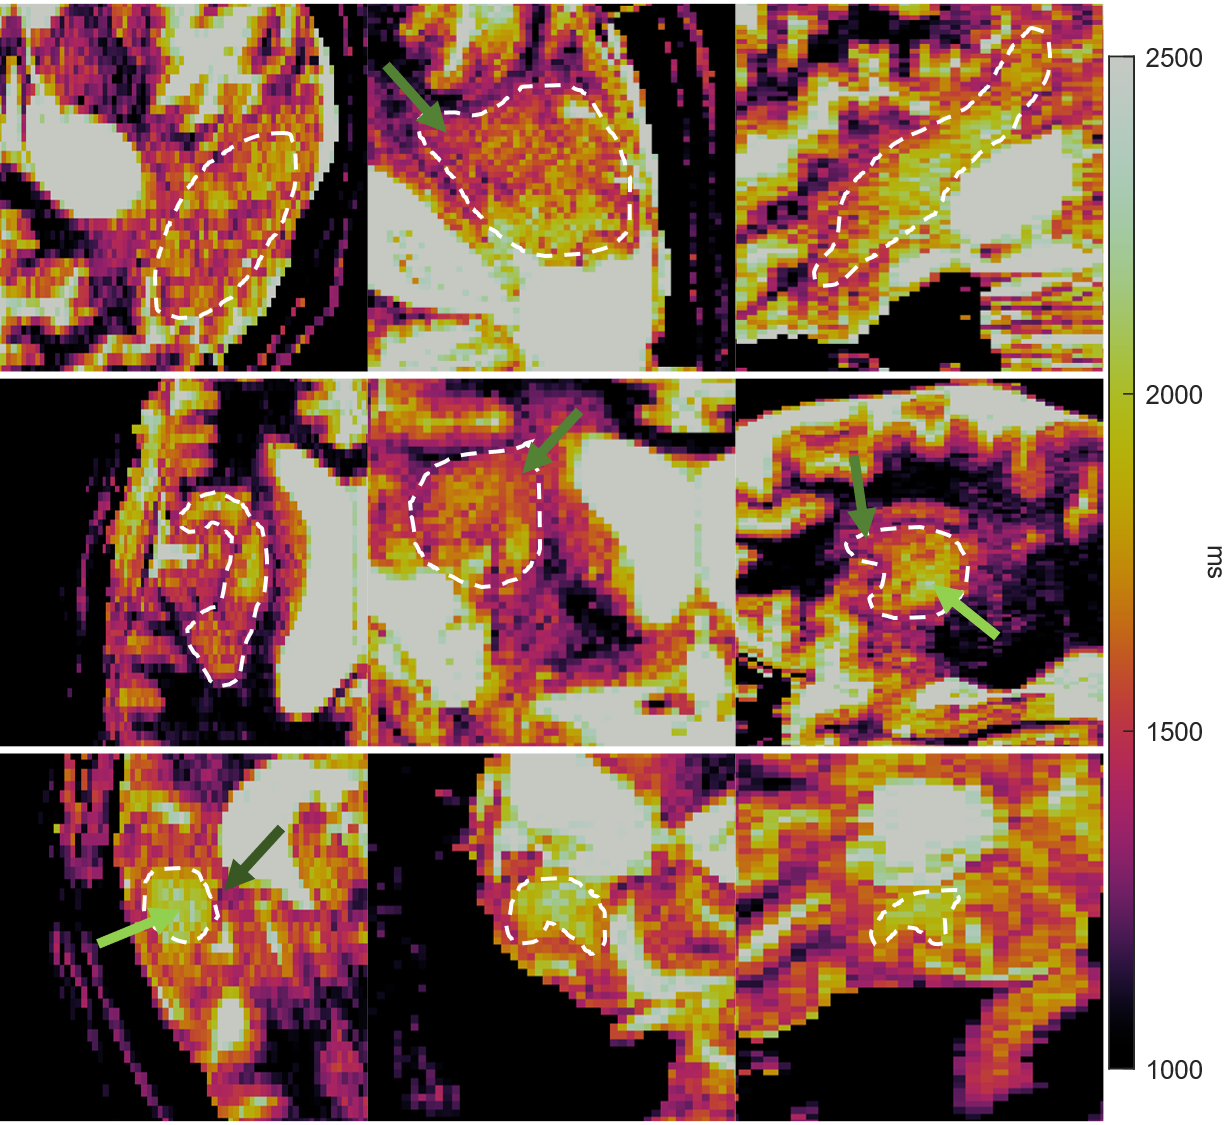
Figure 2: Closeup of T1
maps from the axial, coronal and sagittal views on three patients shown in Figure
1.
Maps are zoomed into the tumor region (delineated by white dashed lines in Figure
1),
with constrained display range. The proposed method captures T1
heterogeneity. Light green: high T1 values, green: medium T1
values and dark green: low T1 values. Coefficients of variation for T1 inside
the ROIs are 10.84%, 9.96%, and 7.31% for the top, middle, and bottom rows,
respectively.