Friederike Hesse1, Alan Wright1, Vencel Somai1,2, Flaviu Bulat1,3, and Kevin Brindle1,4
1Cancer Research UK Cambridge Institute, Cambridge, United Kingdom, 2Department of Radiology, University of Cambridge, Cambridge, United Kingdom, 3Department of Chemistry, University of Cambridge, Cambridge, United Kingdom, 4Department of Biochemistry, University of Cambridge, Cambridge, United Kingdom
1Cancer Research UK Cambridge Institute, Cambridge, United Kingdom, 2Department of Radiology, University of Cambridge, Cambridge, United Kingdom, 3Department of Chemistry, University of Cambridge, Cambridge, United Kingdom, 4Department of Biochemistry, University of Cambridge, Cambridge, United Kingdom
Tumor malate production from [2,3-2H2] fumarate increased significantly within seven days of targeted radio-chemotherapy, demonstrating the potential of 2H-labeled fumarate for assessing GB tumor cell death and the early responses of brain tumors to treatment.
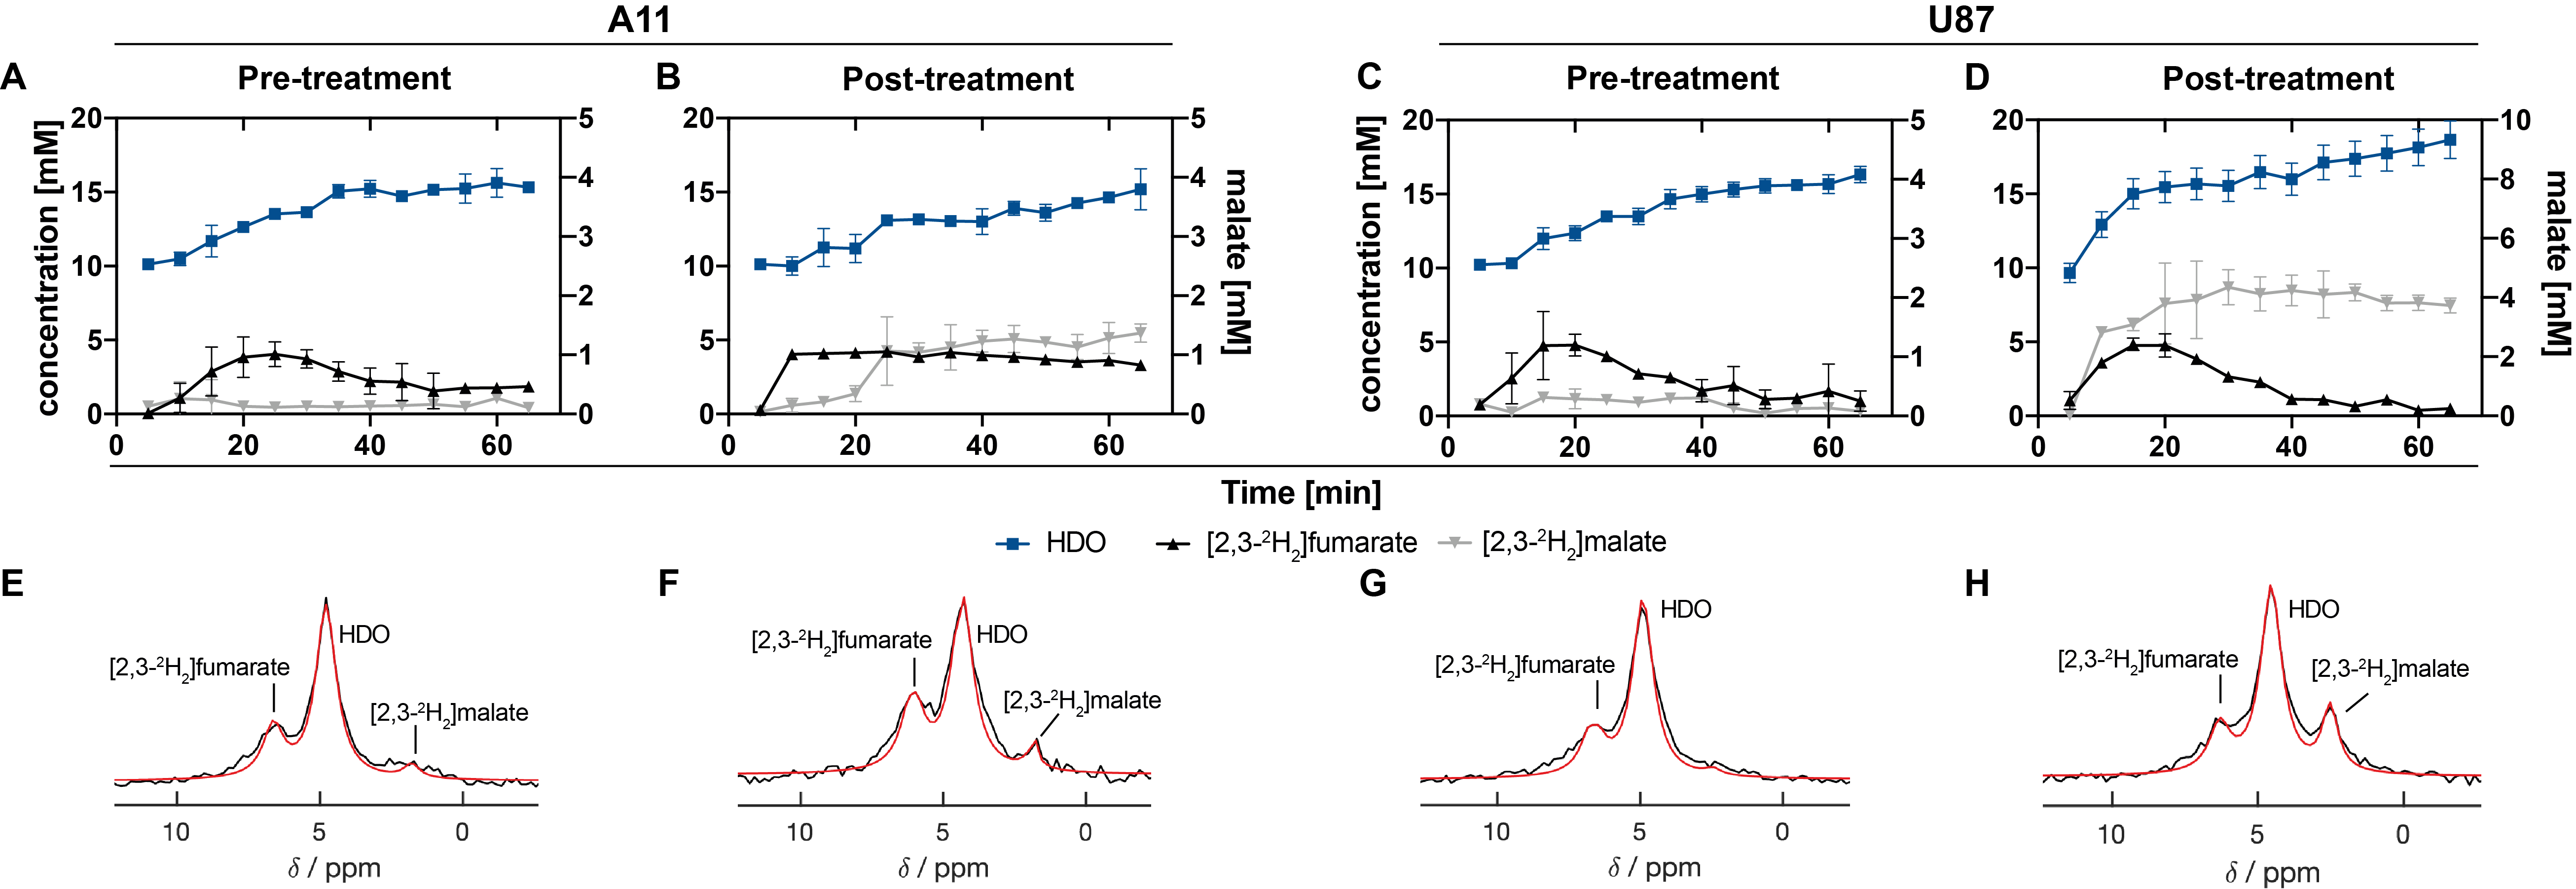
Figure 1 2H MR spectroscopic measurements of labeled fumarate, malate and water concentrations in A11 (A, B, E,F) and U87 (C,D,G,H) tumors. Tumor spectra were acquired before and 7 days after targeted radio-chemotherapy (10 Gy in total, temozolamide 100 mg/kg). (E – H) Sum of 12 2H spectra recorded over 60 minutes. The [2,3-2H2]fumarate injection (1 g/kg) started 5 min after the start of acquisition of the first spectrum. The peaks were fitted individually using prior knowledge.
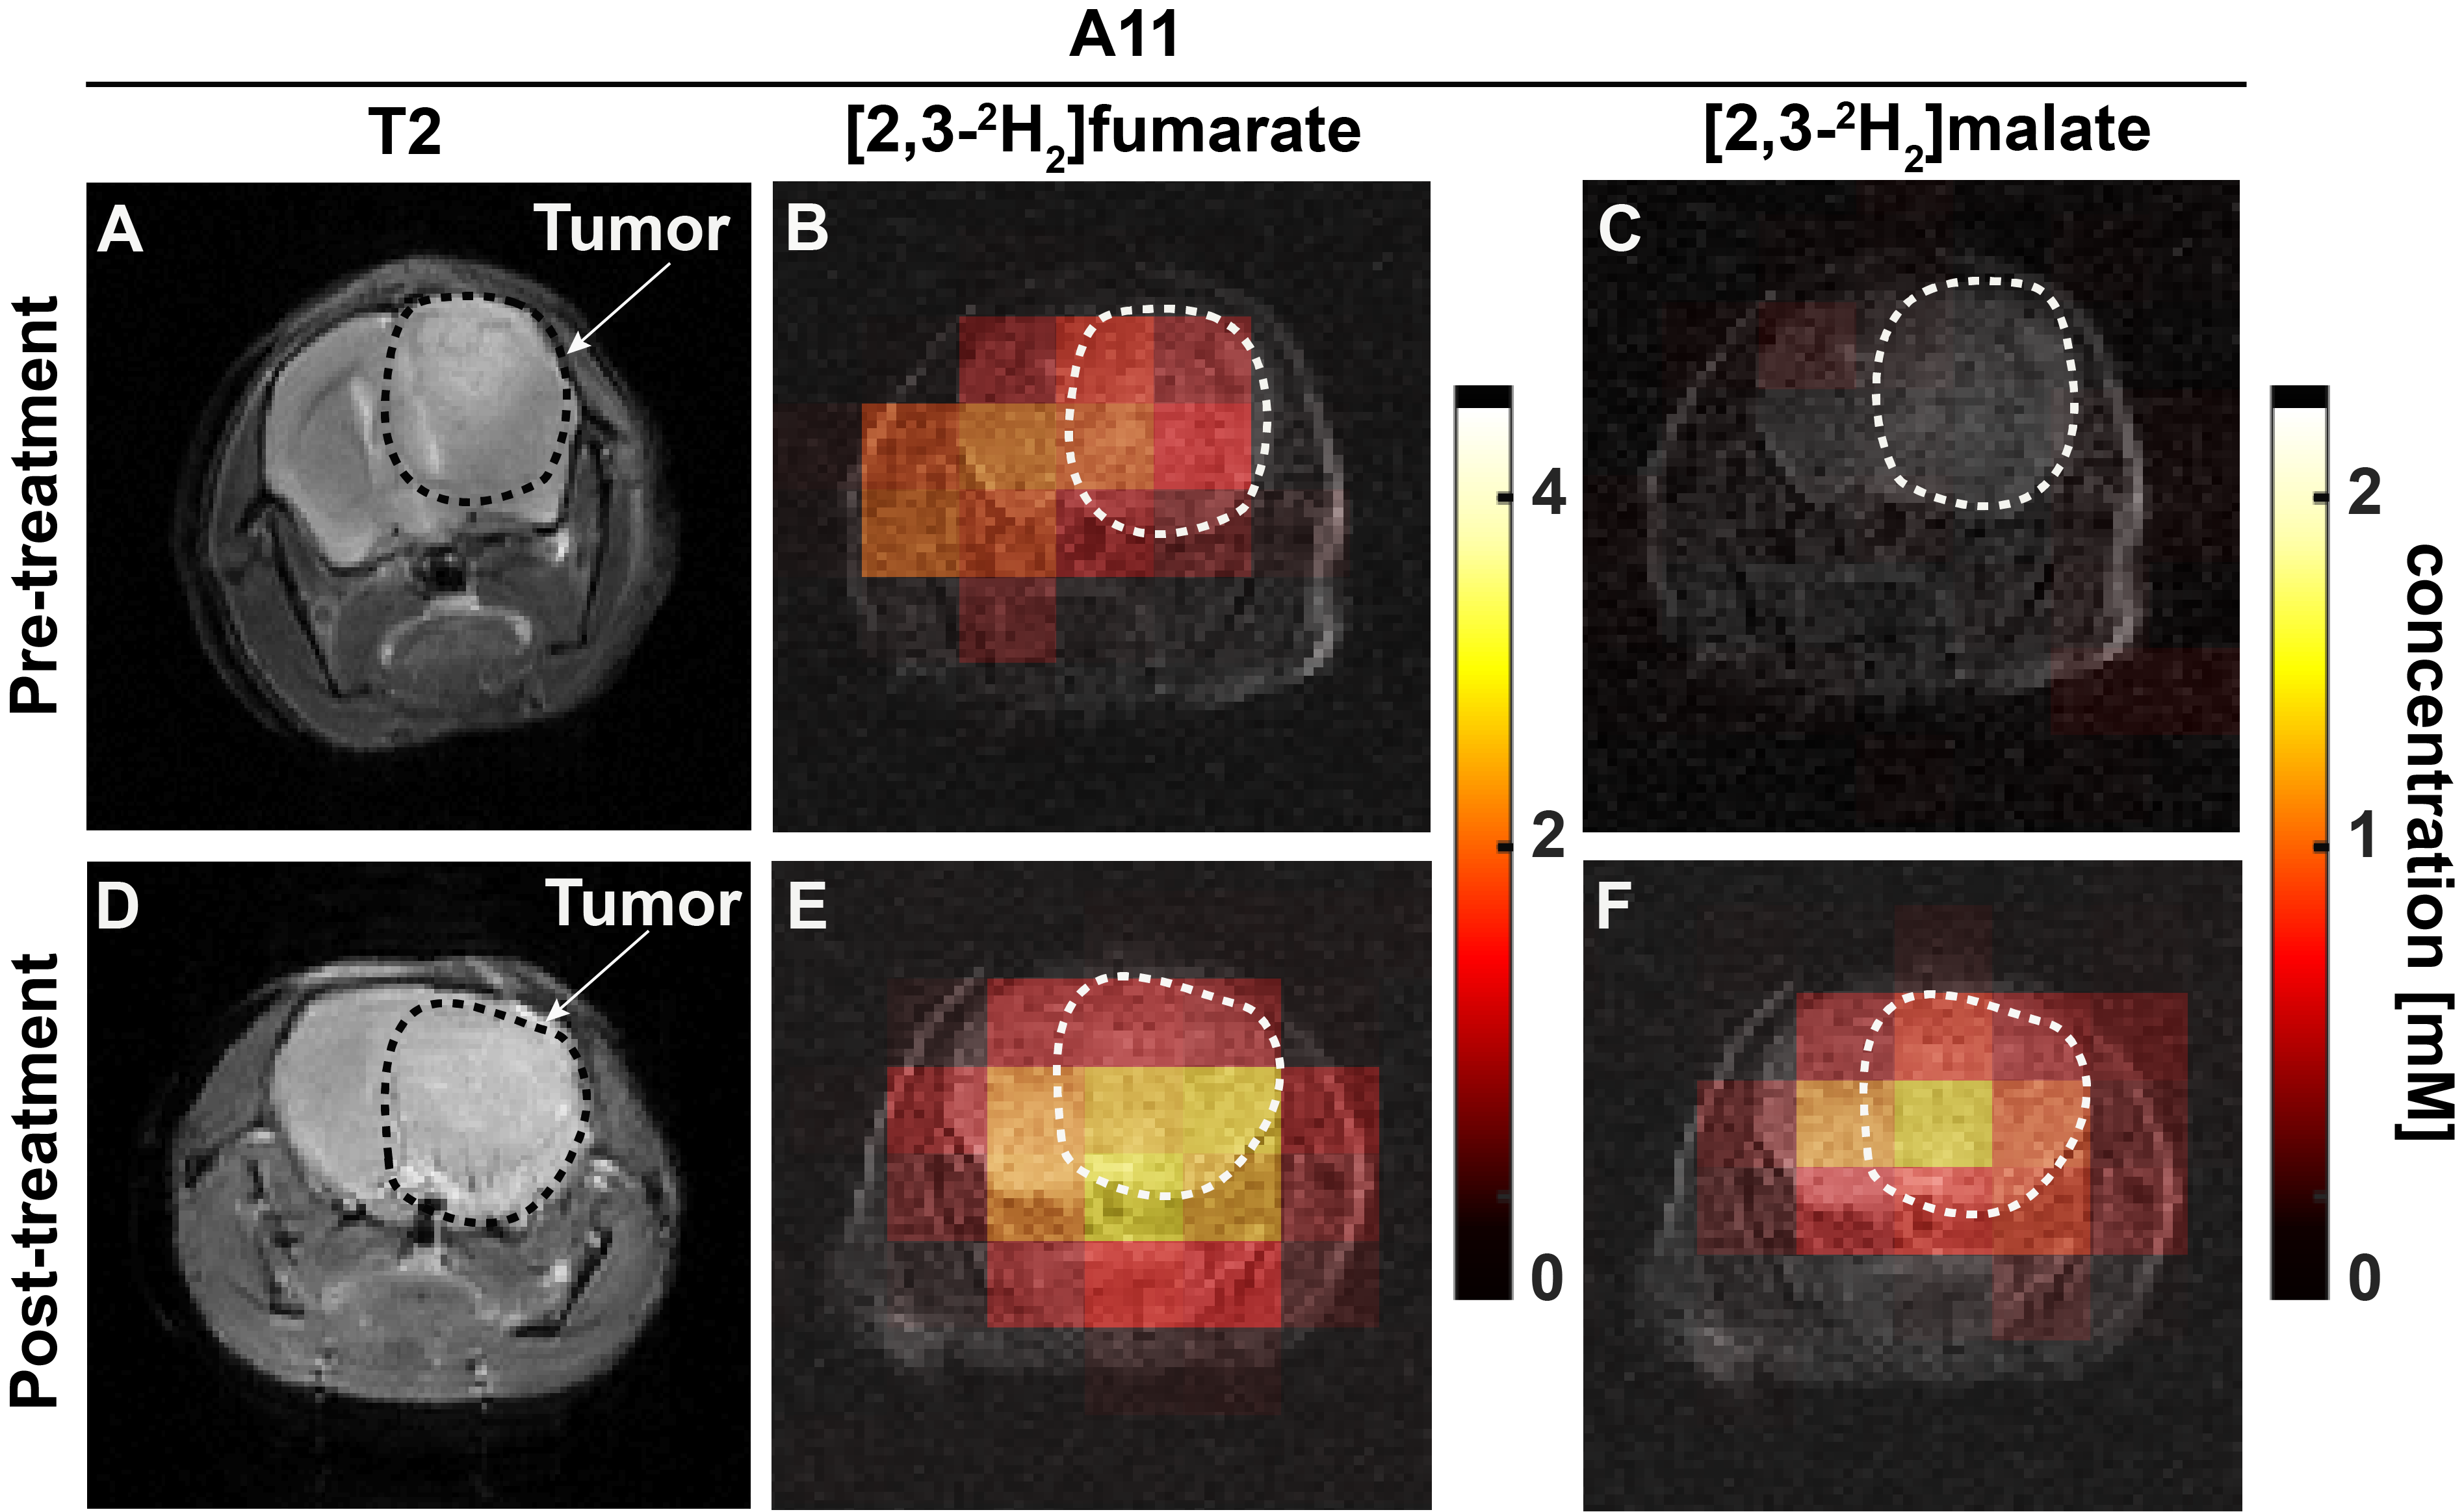
Figure 2 Metabolite concentration maps derived from dynamic 3D CSI images summed over 60 min of signal acquisition following fumarate injection into A11 tumor-bearing mice. The color code represents concentration in mM derived from the ratios of the peak intensities in the malate and fumarate maps to peak intensities in an initial HDO map and corrected for the number of 2H labels per molecule and signal saturation. (A,D) T2-weighted axial slices from a reference 1H image. Concentration maps of (B) fumarate and (C) malate pre-treatment; (E) fumarate and (F) malate 7 days post-treatment.