Anna Sophie Wittgenstein1, Marco Barbero Mota2, Giacomo Annio2, Guillaume Rucher2, Rachida Aid-Launais2, Rami Mustapha3, David Alexander Nordsletten1,4, and Ralph Sinkus1,2
1School of Biomedical Engineering and Imaging Sciences, King's College London, London, United Kingdom, 2INSERM-Université de Paris, Paris, France, 3chool of Cancer and Pharmaceutical Sciences, King's College London, London, United Kingdom, 4Department of Biomedical Engineering and Cardiac Surgery, University of Michigan, Ann Habor, MI, United States
1School of Biomedical Engineering and Imaging Sciences, King's College London, London, United Kingdom, 2INSERM-Université de Paris, Paris, France, 3chool of Cancer and Pharmaceutical Sciences, King's College London, London, United Kingdom, 4Department of Biomedical Engineering and Cardiac Surgery, University of Michigan, Ann Habor, MI, United States
The current methodology allows to actually sample several punches
throughout the cardiac cycle whereby enabling a simple way to quantify changes
in biomechanics during systole and diastole, without prolongation of data
acquisition time.
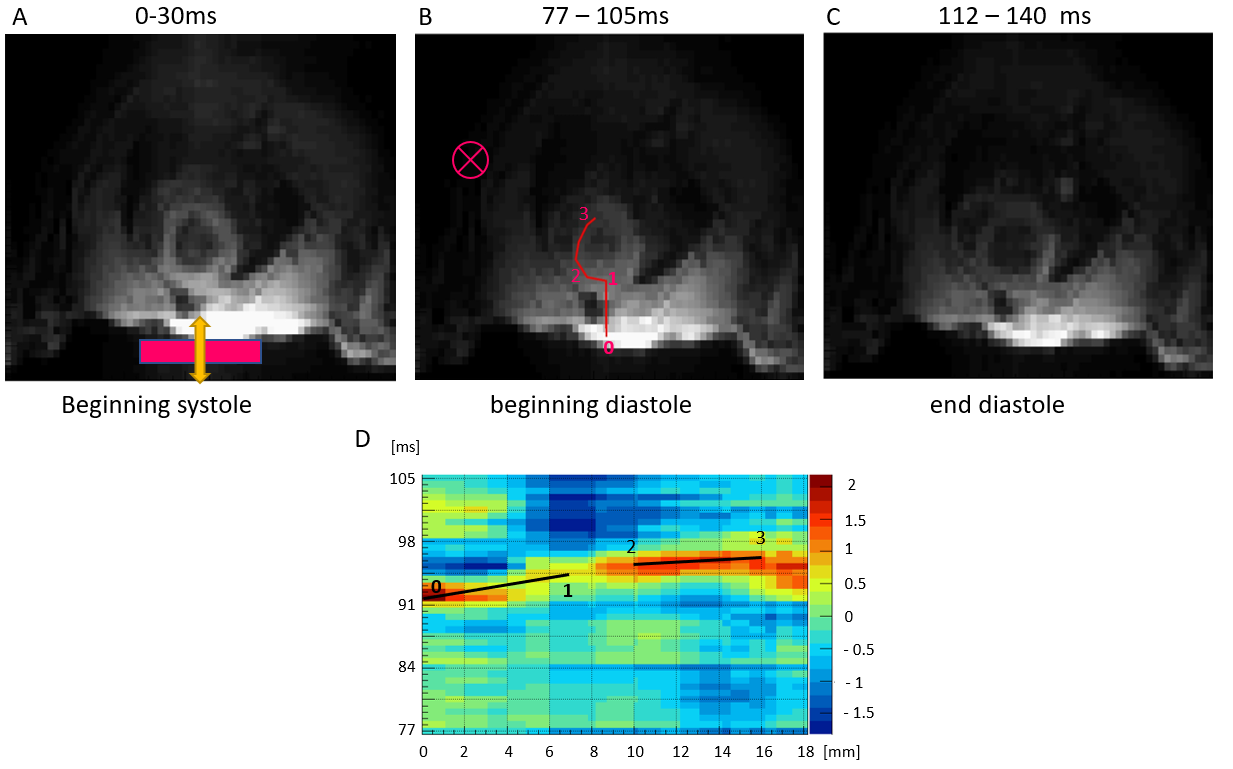
Figure 4: Magnitude images with a resolution of 1x1mm and the waterfall diagram along the indicated path (pink) (A) The location of the transducer underneath the torso is indicated by the block and the direction of vibration by the arrow in the magnitude image.(B) Magnitude image at the start of diastole with the wave plane through slices (pink cross) and the path for the waterfall-diagram (C) Magnitude image of the rats’ shape of the heart at end diastole, showing the left and right ventricle. (D) Waterfall-diagram, showing the travelled distance over time along the path indicated in B.
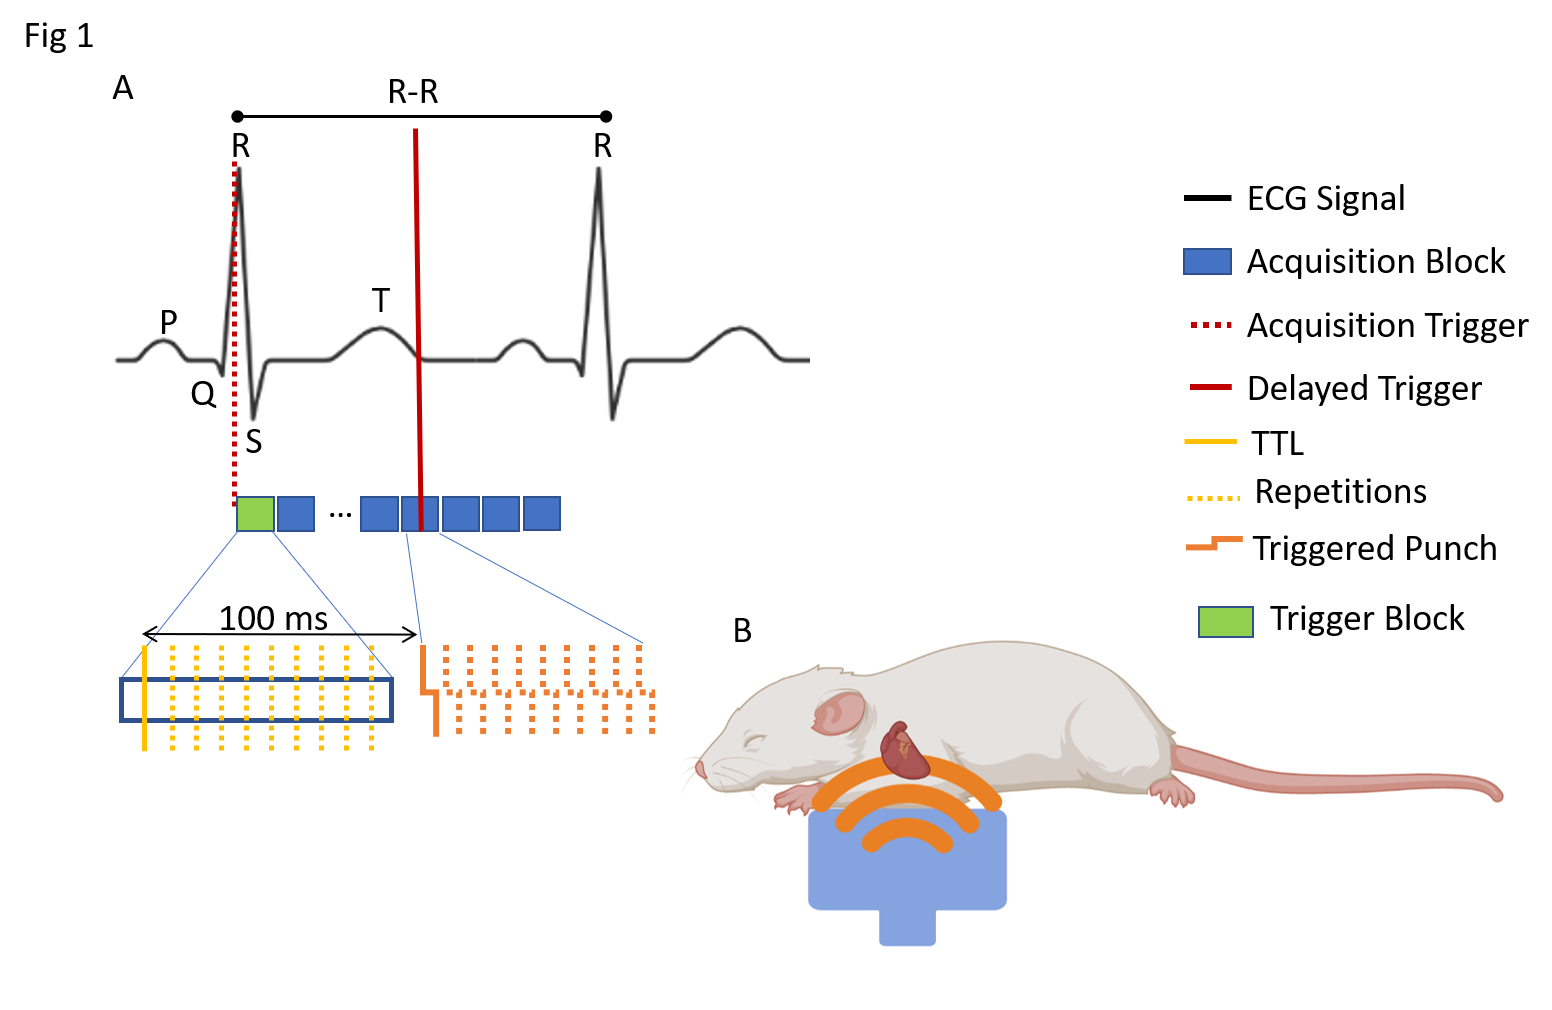
Figure 1: TTL: Transistor-transistor logic trigger; A) ECG+respiratory gated acquisition. Delaying 100 ms each mechanical push (200 Hz) trigger with respect to R spike (TTL) ensures consistent diastolic acquisition. 10 acquisition repetitions with an increment of 0.7 ms delays among them artificially lower temporal resolution to 0.7 ms. B) Diagram of the anesthetized rat and how thoracic excitation is executed for generation of internal shear waves that travel towards and through the heart.