Lin Chen1,2, Peter C.M. van Zijl1,2, Zhiliang Wei1,2, Hanzhang Lu1,2, Wenzhen Duan3, Philip C. Wang4,5, Tong Li4,5, and Jiadi Xu1,2
1Department of Radiology and Radiological Science, Johns Hopkins University, Baltimore, MD, United States, 2F.M. Kirby Research Center for Functional Brain Imaging, Kennedy Krieger Research Institute, Baltimore, MD, United States, 3Department of Psychiatry and Behavioral Sciences, Johns Hopkins University, Baltimore, MD, United States, 4Department of Pathology, Johns Hopkins University, Baltimore, MD, United States, 5Department of Neuroscience, Johns Hopkins University, Baltimore, MD, United States
1Department of Radiology and Radiological Science, Johns Hopkins University, Baltimore, MD, United States, 2F.M. Kirby Research Center for Functional Brain Imaging, Kennedy Krieger Research Institute, Baltimore, MD, United States, 3Department of Psychiatry and Behavioral Sciences, Johns Hopkins University, Baltimore, MD, United States, 4Department of Pathology, Johns Hopkins University, Baltimore, MD, United States, 5Department of Neuroscience, Johns Hopkins University, Baltimore, MD, United States
Young AD mice have reduced intracellular pH compared to WT mice,
which preceded the tangle and plaque formation. pH has the potential to be a
biomarker for early diagnosis of AD.
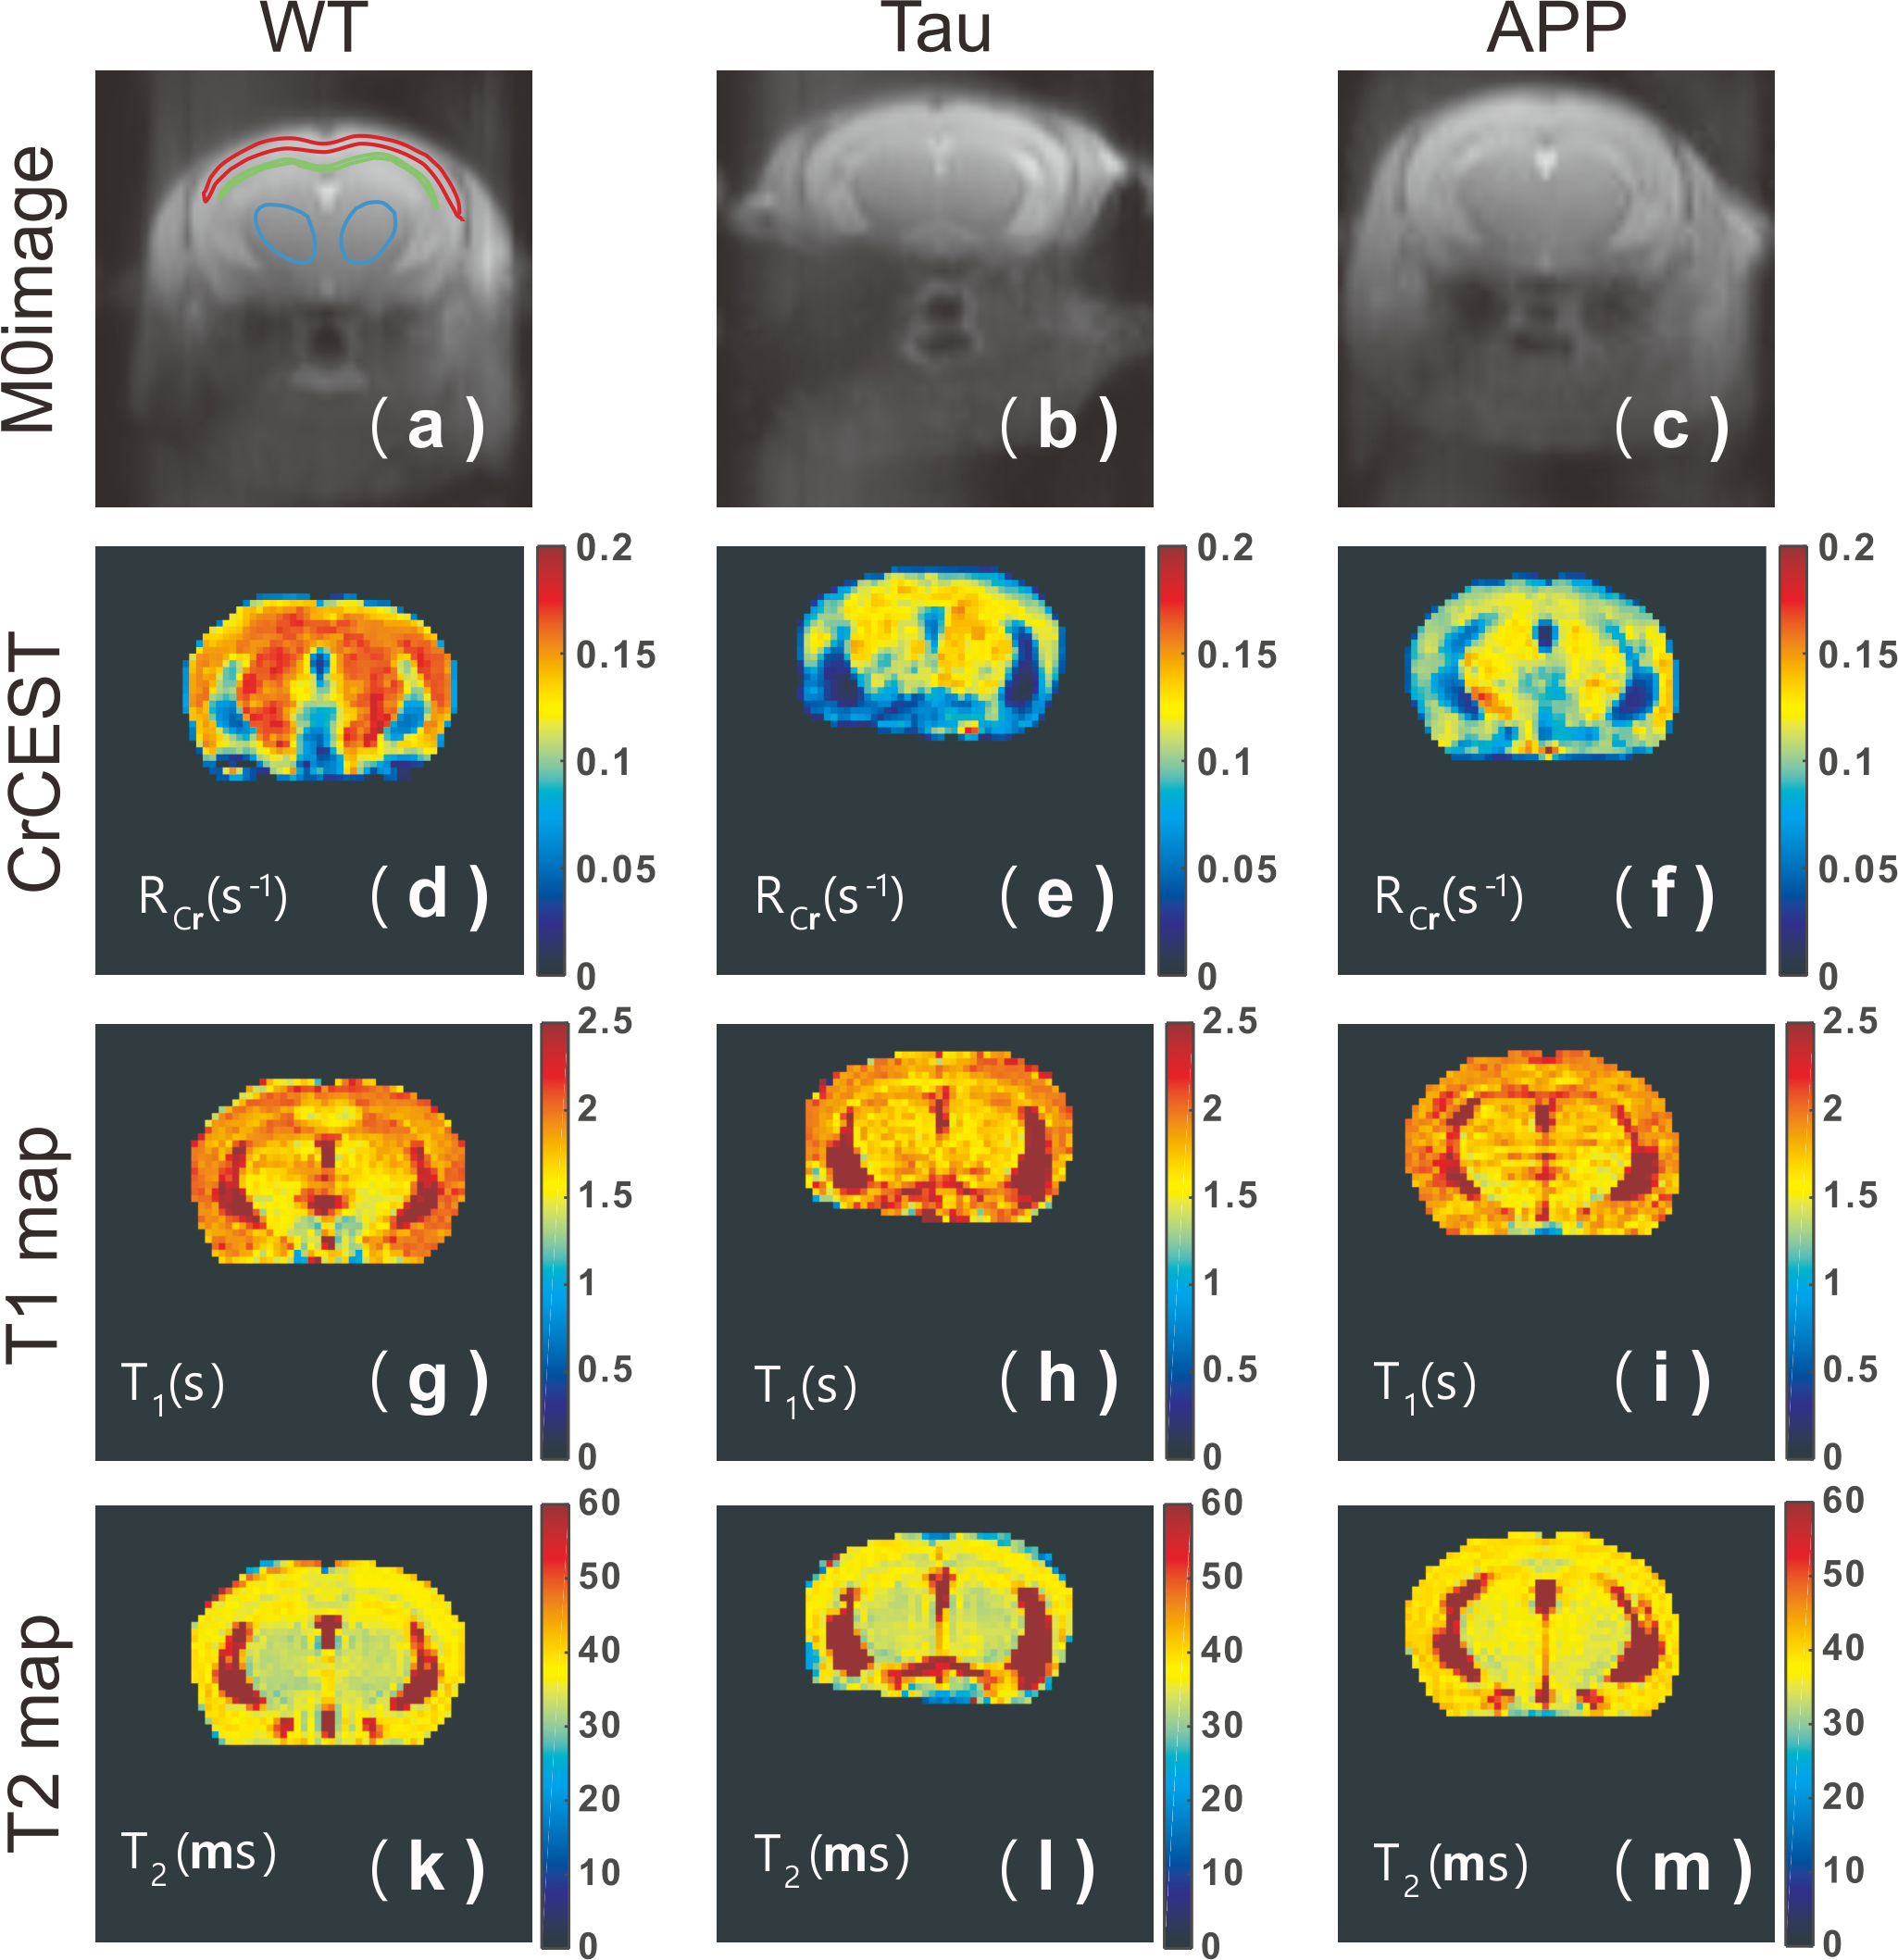
Figure 1: Typical S0
(a, b, c), CrCEST (d, e, f), T1 (g, h, i) and T2 maps
(k,l,m) for WT (a, d, g, k), Tau (b, e,
h, l), and APP (c, f, i, m) mice. The CrCEST maps (RCr) of Tau and APP mice showed clear reduction
compared to that of WT mice, while the T1 and T2 maps were closely resembled among the three types of
mice. The typical ROIs used to extract regional values are indicated in (a).
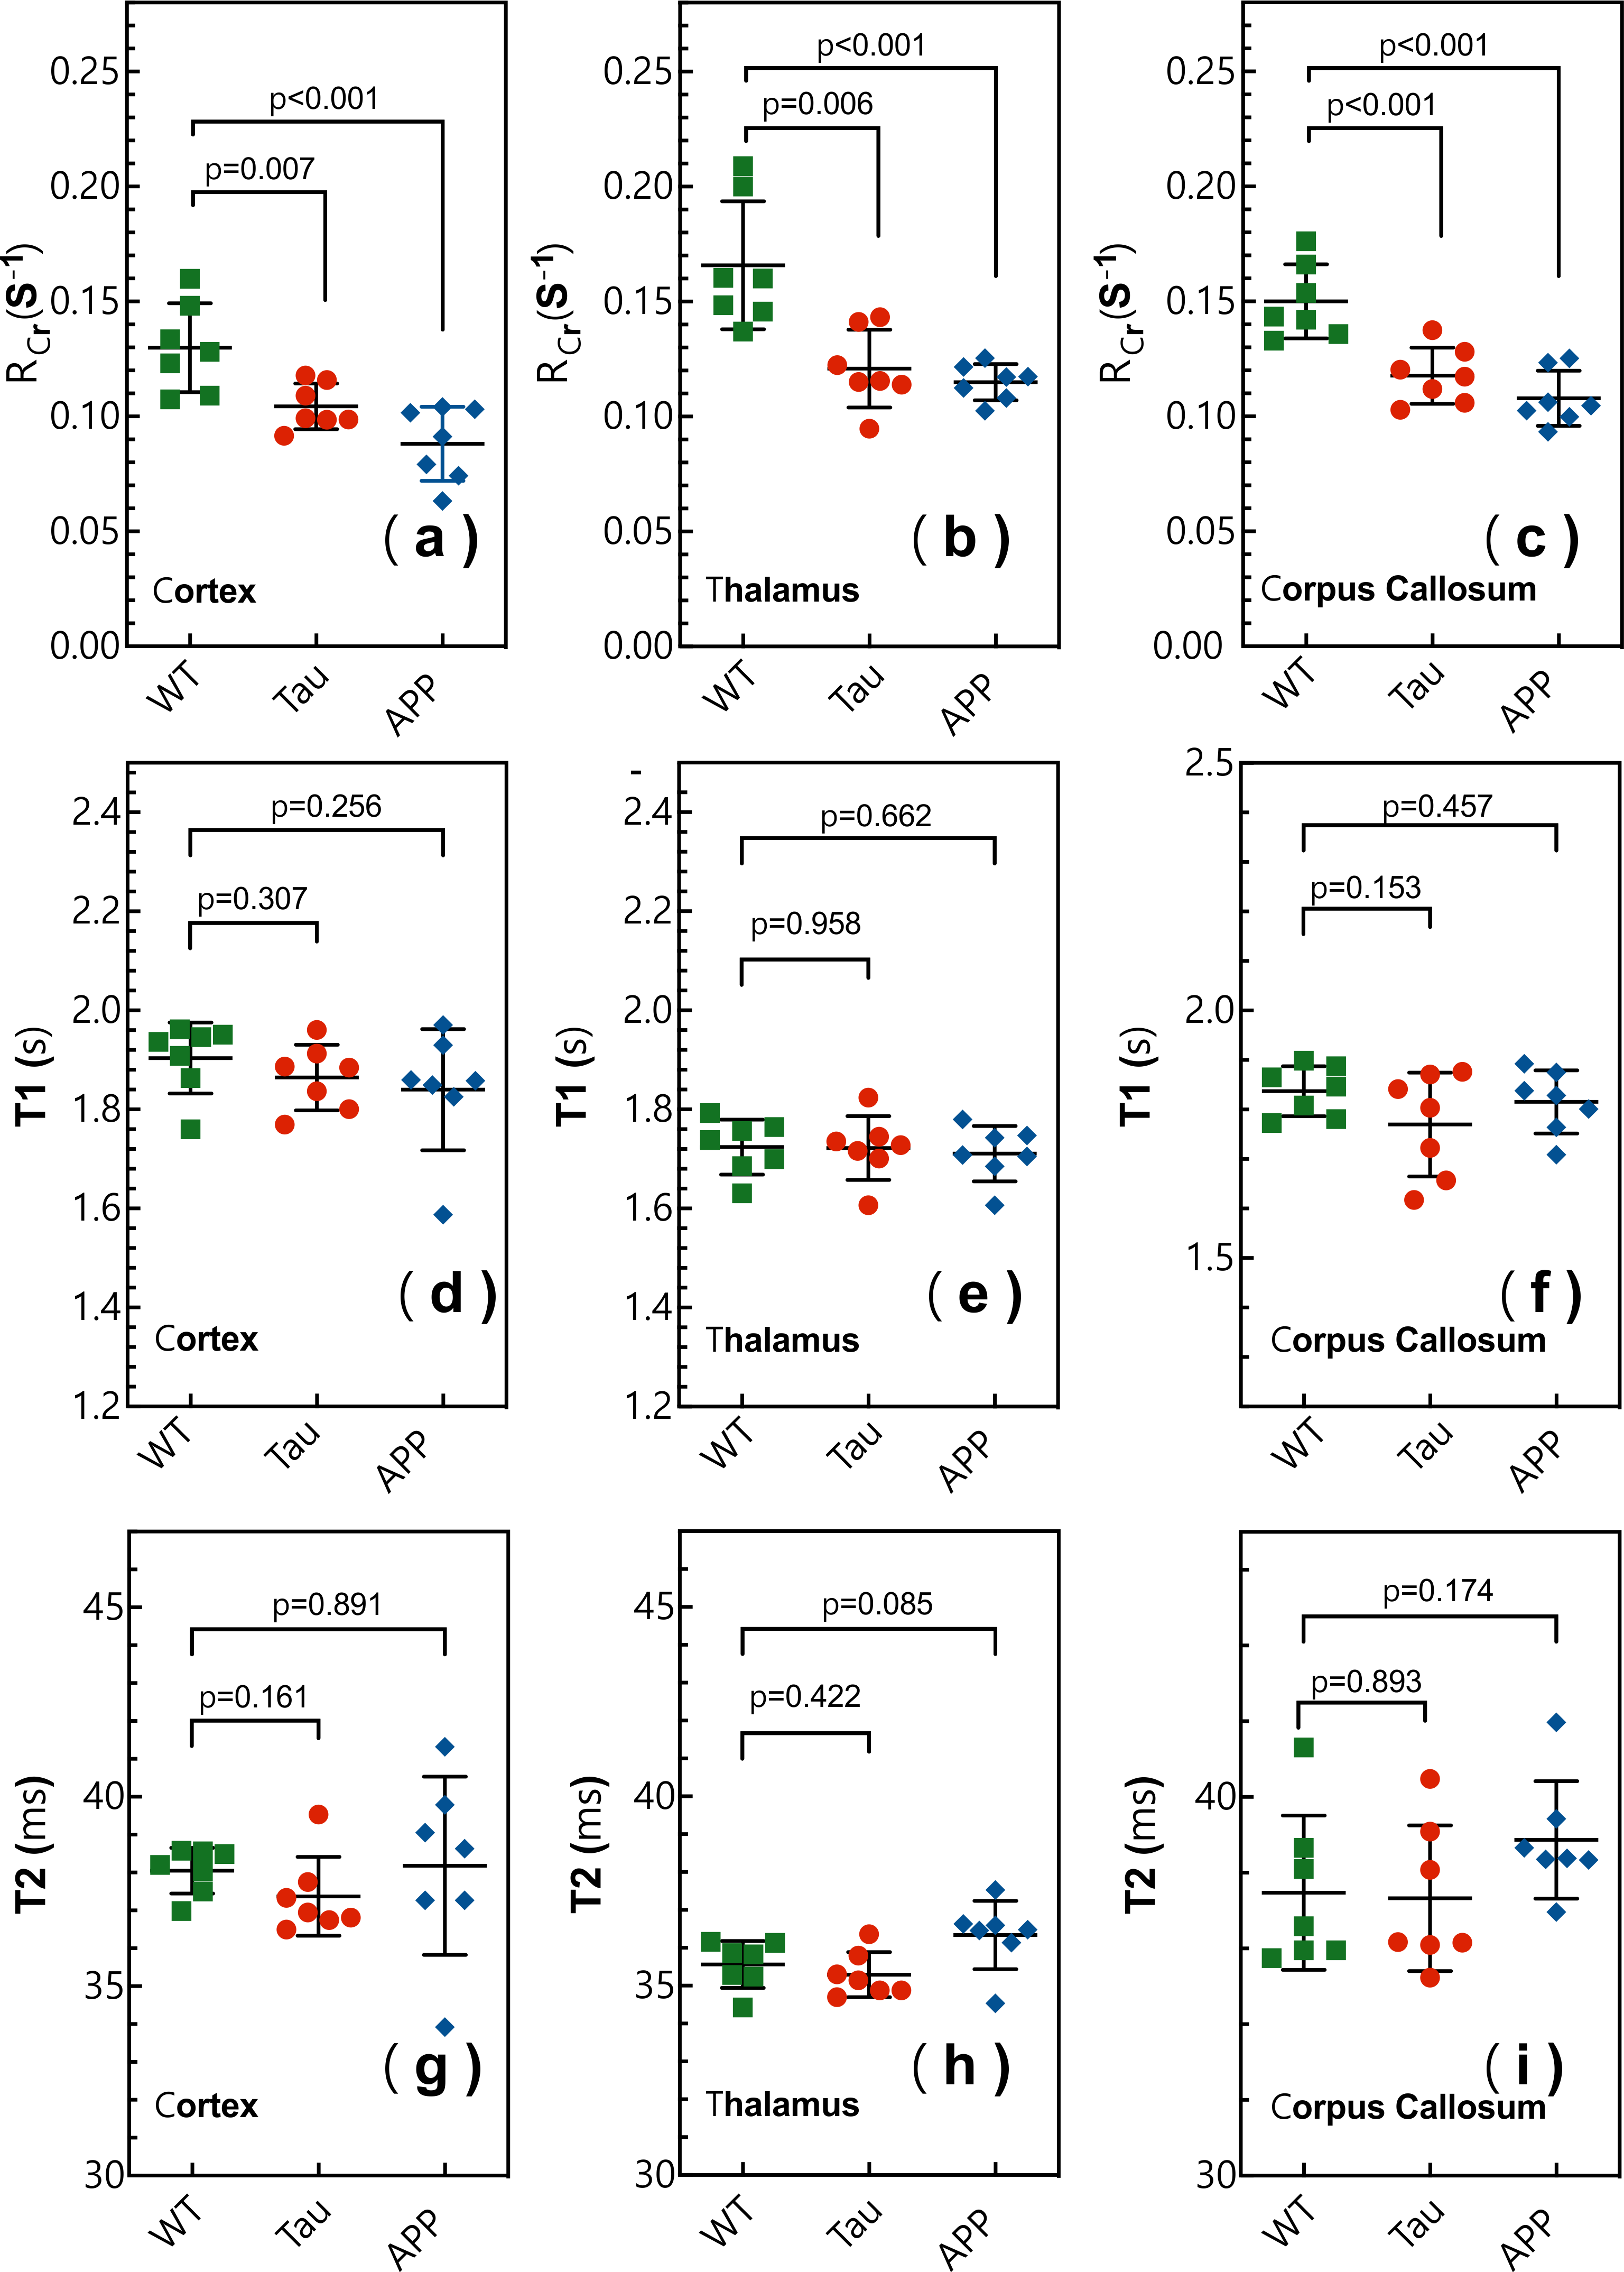
Figure
2. The CrCEST values (RCr)
represented by Cr apparent relaxation rate for
cortex (a ), thalamus (b), and corpus callosum (c) regions in WT (green
square), Tau (red circle) and APP (blue diamond) mice. The T1 values
for cortex (d), thalamus (e), and corpus callosum regions (f) in WT (green
square), Tau (red circle) and APP (blue diamond) mice. The T2 values
for cortex (g), thalamus (h), and corpus callosum regions (i) in WT (green
square), Tau (red circle) and APP (blue diamond) mice.