Kyeongseon Min1, Sungkwon Chung2, Phan Tan Toi3,4, Jongho Lee1, Seung‐Kyun Lee3,4,5, and Jang-Yeon Park3,4
1Laboratory for Imaging Science and Technology, Department of Electrical and Computer Engineering, Seoul National Univeristy, Seoul, Korea, Republic of, 2Department of Physiology, Samsung Biomedical Research Institute, Sungkyunkwan University School of Medicine, Suwon, Korea, Republic of, 3Department of Biomedical Engineering, Sungkyunkwan University, Suwon, Korea, Republic of, 4Department of Intelligent Precision Healthcare Convergence, Sungkyunkwan University, Suwon, Korea, Republic of, 5Center for Neuroscience Imaging Research, Institute for Basic Science, Suwon, Korea, Republic of
1Laboratory for Imaging Science and Technology, Department of Electrical and Computer Engineering, Seoul National Univeristy, Seoul, Korea, Republic of, 2Department of Physiology, Samsung Biomedical Research Institute, Sungkyunkwan University School of Medicine, Suwon, Korea, Republic of, 3Department of Biomedical Engineering, Sungkyunkwan University, Suwon, Korea, Republic of, 4Department of Intelligent Precision Healthcare Convergence, Sungkyunkwan University, Suwon, Korea, Republic of, 5Center for Neuroscience Imaging Research, Institute for Basic Science, Suwon, Korea, Republic of
In this study, we observed that depolarization of SH-SY5Y
cells leads to an increase in T1 and T2 and a decrease in
pool size ratio (PSR). Contrarily, when SH-SY5Y cells were hyperpolarized, T1
and T2 decreased and PSR increased.
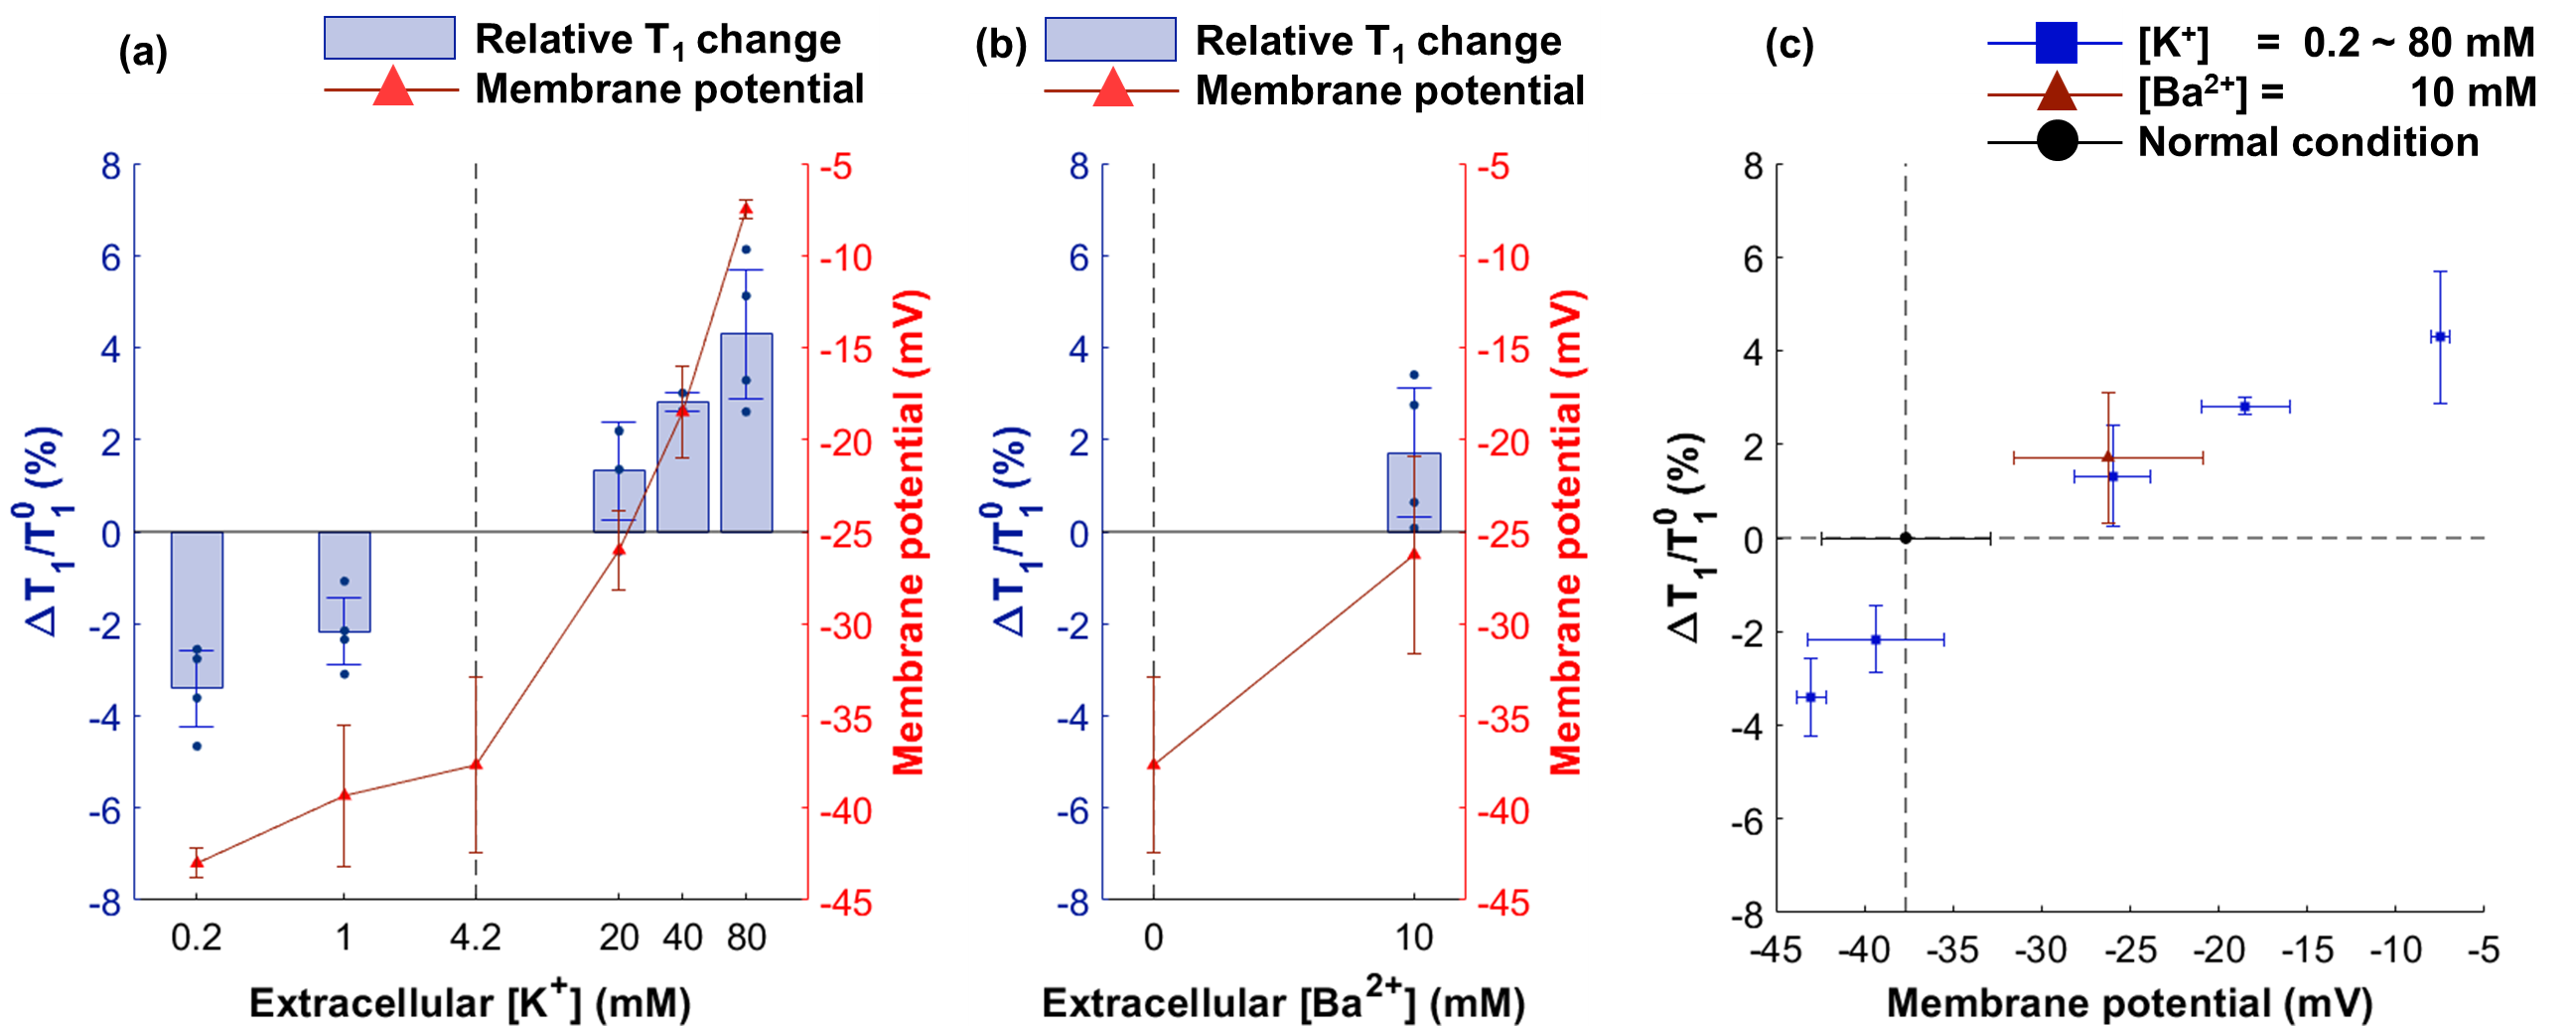
Figure 2. The relative changes in T1 and
the corresponding membrane potentials. The dotted black lines in each plot
represent the normal condition. (a): Relative T1 changes and the
membrane potentials when those are altered by [K+]. (b): Relative T1
changes and the membrane potentials when those are altered by [Ba2+].
(c): Relative T1 changes in (a) and (b) are illustrated on the same
plot using the abscissa of membrane potentials.
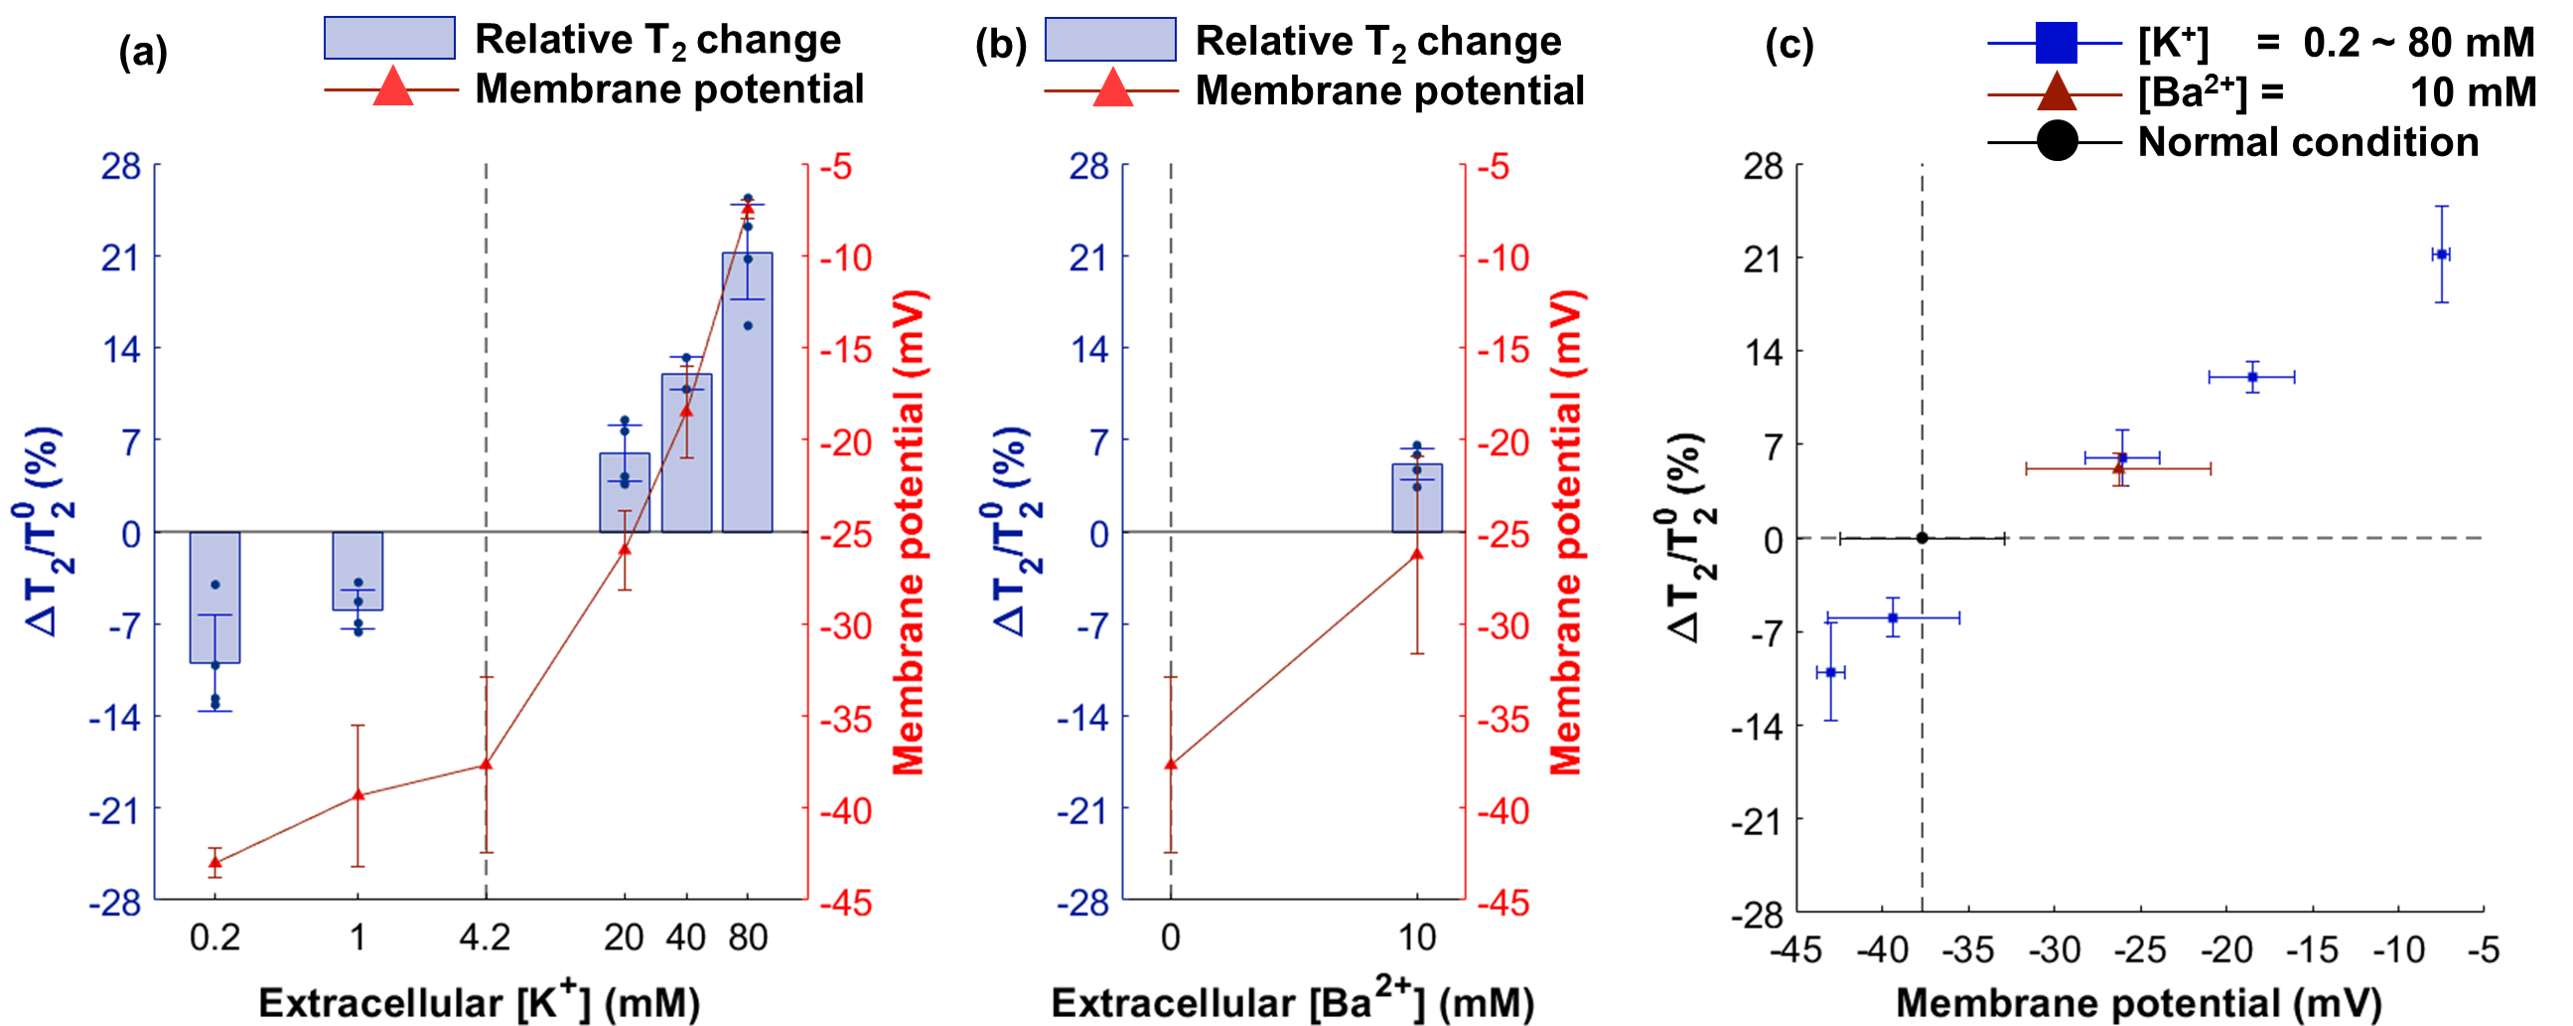
Figure 3. The relative
changes in T2 and the corresponding membrane potentials. The dotted
black lines in each plot represent the normal condition. (a): Relative T2
changes and the membrane potentials when those are altered by [K+].
(b): Relative T2 changes and the membrane potentials when those are
altered by [Ba2+]. (c): Relative T2 changes in (a) and (b)
are illustrated on the same plot using the abscissa of membrane potentials.