Vinod Jangid Kumar1, Klaus Scheffler1,2, Gisela E Hagberg1,2, and Wolfgang Grodd1
1Max Planck Institute for Biological Cybernetics, Tuebingen, Germany, 2Biomedical Magnetic Resonance, University Hospital and Eberhard-Karl’s University, Tuebingen, Germany
1Max Planck Institute for Biological Cybernetics, Tuebingen, Germany, 2Biomedical Magnetic Resonance, University Hospital and Eberhard-Karl’s University, Tuebingen, Germany
The
preliminary results show lower diamagnetic and paramagnetic sources for the
core nuclei. In contrast, the matrix
nuclei showed observable higher values.
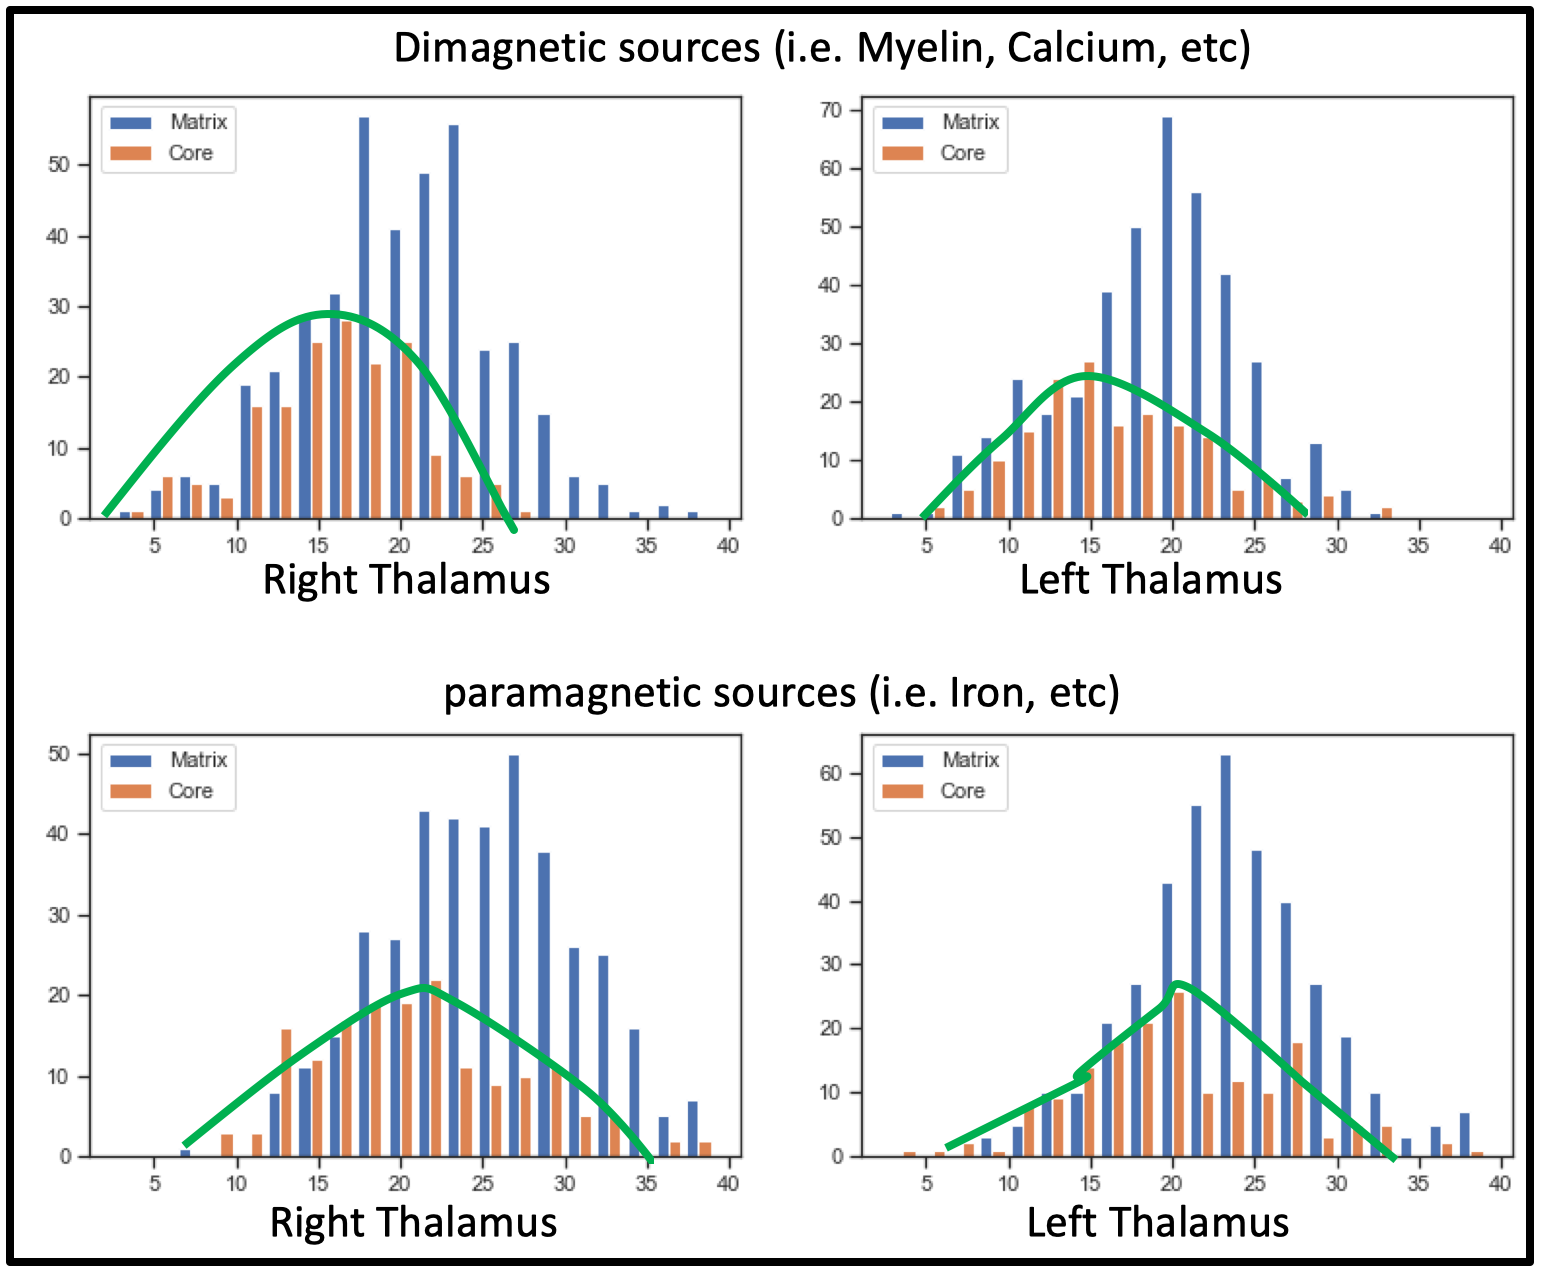
Fig. 4: Histogram of the mean values for the diamagnetic and paramagnetic sources
of all nuclei. Each Histogram shows values for the matrix nuclei in blue color and
the core nuclei in red color. Note the
lower values for the core nuclei in contrast to matrix nuclei indicating the
more substantial contribution of diamagnetic and paramagnetic sources, i.e.,
iron, myelin, and calcium in the matrix nuclei.
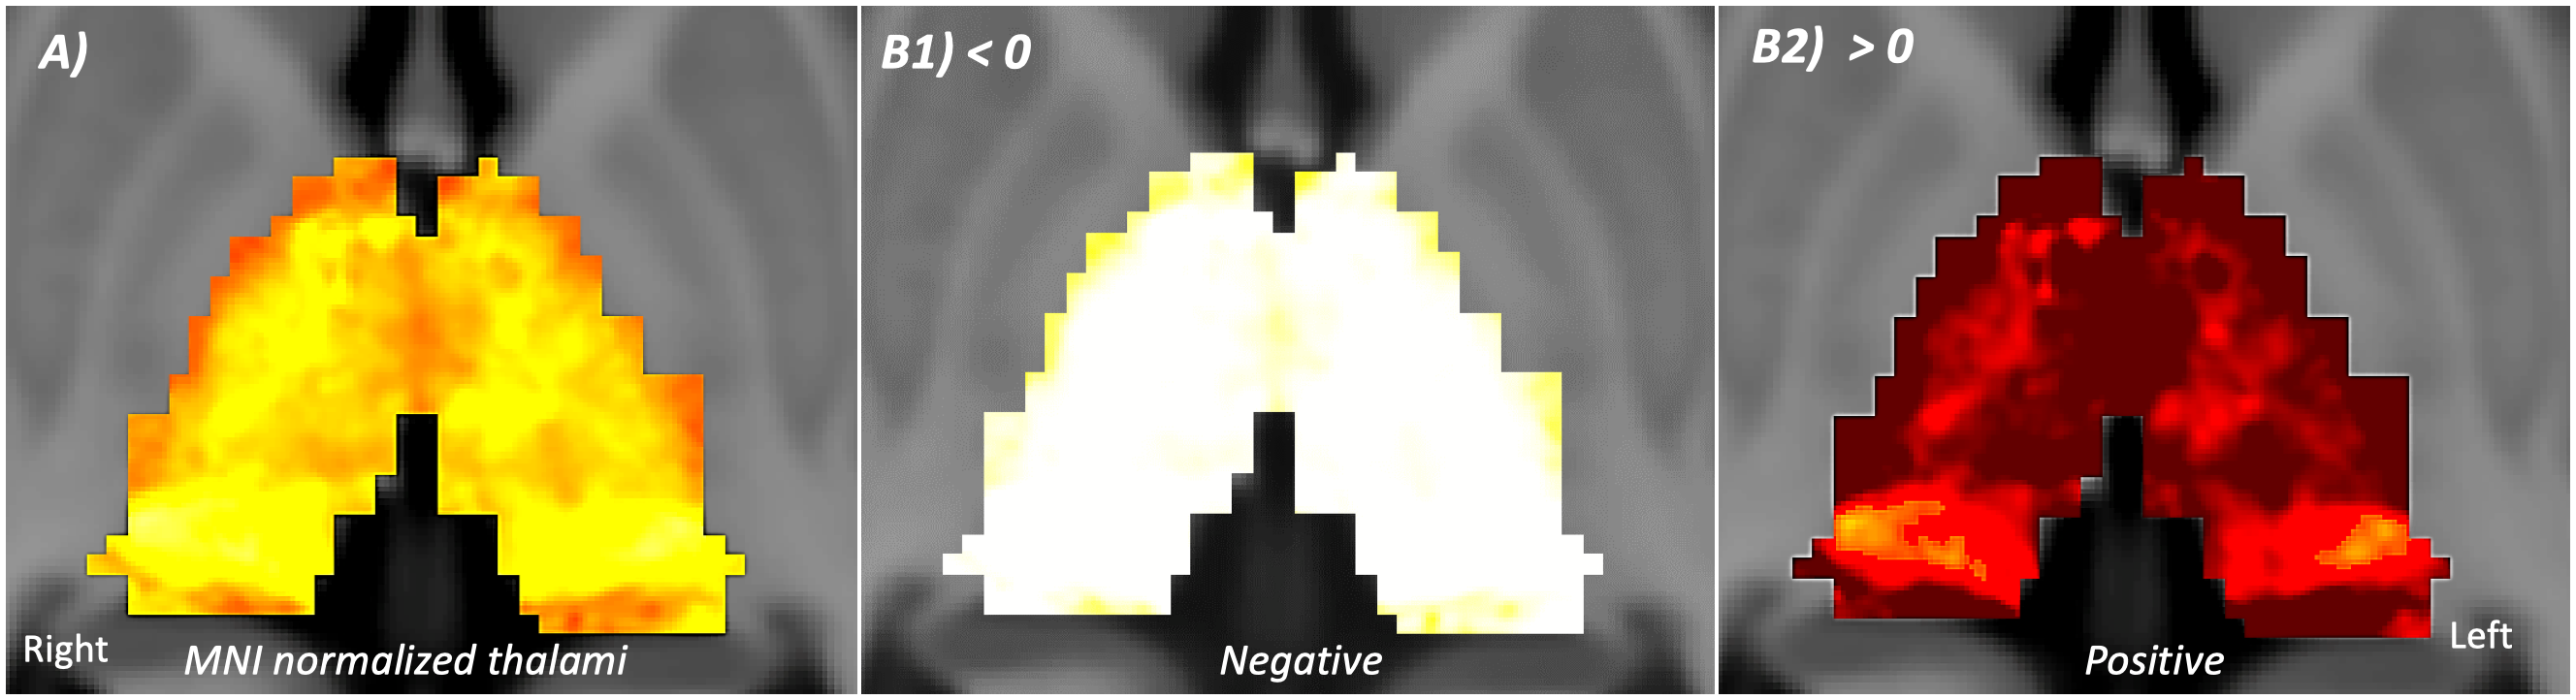
Fig. 1: Thalamus QSM at 9.4 T. A) QSM map (scaled between: -215.0546 to 208.2119)
B1) Negative values: diamagnetic sources
(i.e., Myelin, Calcium, etc.) B2) Positive values (Paramagnetic
sources, i.e., Iron, etc.) Both the values are in parts per billion, i.e., ppb (magnetic
strength irrelevant). The depicted color code for all views is hot. The
negative Myelin map shows a homogeneous distribution of negative QSM values
across the thalamus; in contrast, the positive map shows increased QSM values
mainly at the posterior, lateral, and intralaminar, midline nuclei.