Omer Faruk Gulban1,2, Saskia Bollman3, Renzo Huber1, Kendrick Kay4, Benedikt Poser1, Federico De Martino1, and Dimo Ivanov1
1Department of Cognitive Neuroscience , Faculty of Psychology and Neuroscience, Maastricht University, Maastricht, Netherlands, 2Brain Innovation, Maastricht, Netherlands, 3Centre for Advanced Imaging, The University of Queensland, Brisbane, Australia, 4Center for Magnetic Resonance Research, University of Minnesota, Minneapolis, MN, United States
1Department of Cognitive Neuroscience , Faculty of Psychology and Neuroscience, Maastricht University, Maastricht, Netherlands, 2Brain Innovation, Maastricht, Netherlands, 3Centre for Advanced Imaging, The University of Queensland, Brisbane, Australia, 4Center for Magnetic Resonance Research, University of Minnesota, Minneapolis, MN, United States
- We measured in vivo human brain T2* values using 7T MRI at 0.35 × 0.35 × 0.35 mm3 using MRI at 7 T.
- Gray matter T2* locally varies up to 15 ms within Heschl’s gyrus & Calcarine sulcus across cortical depths.
- T2* seems more affected by biological tissue compositions than local cortex alignment to B0.
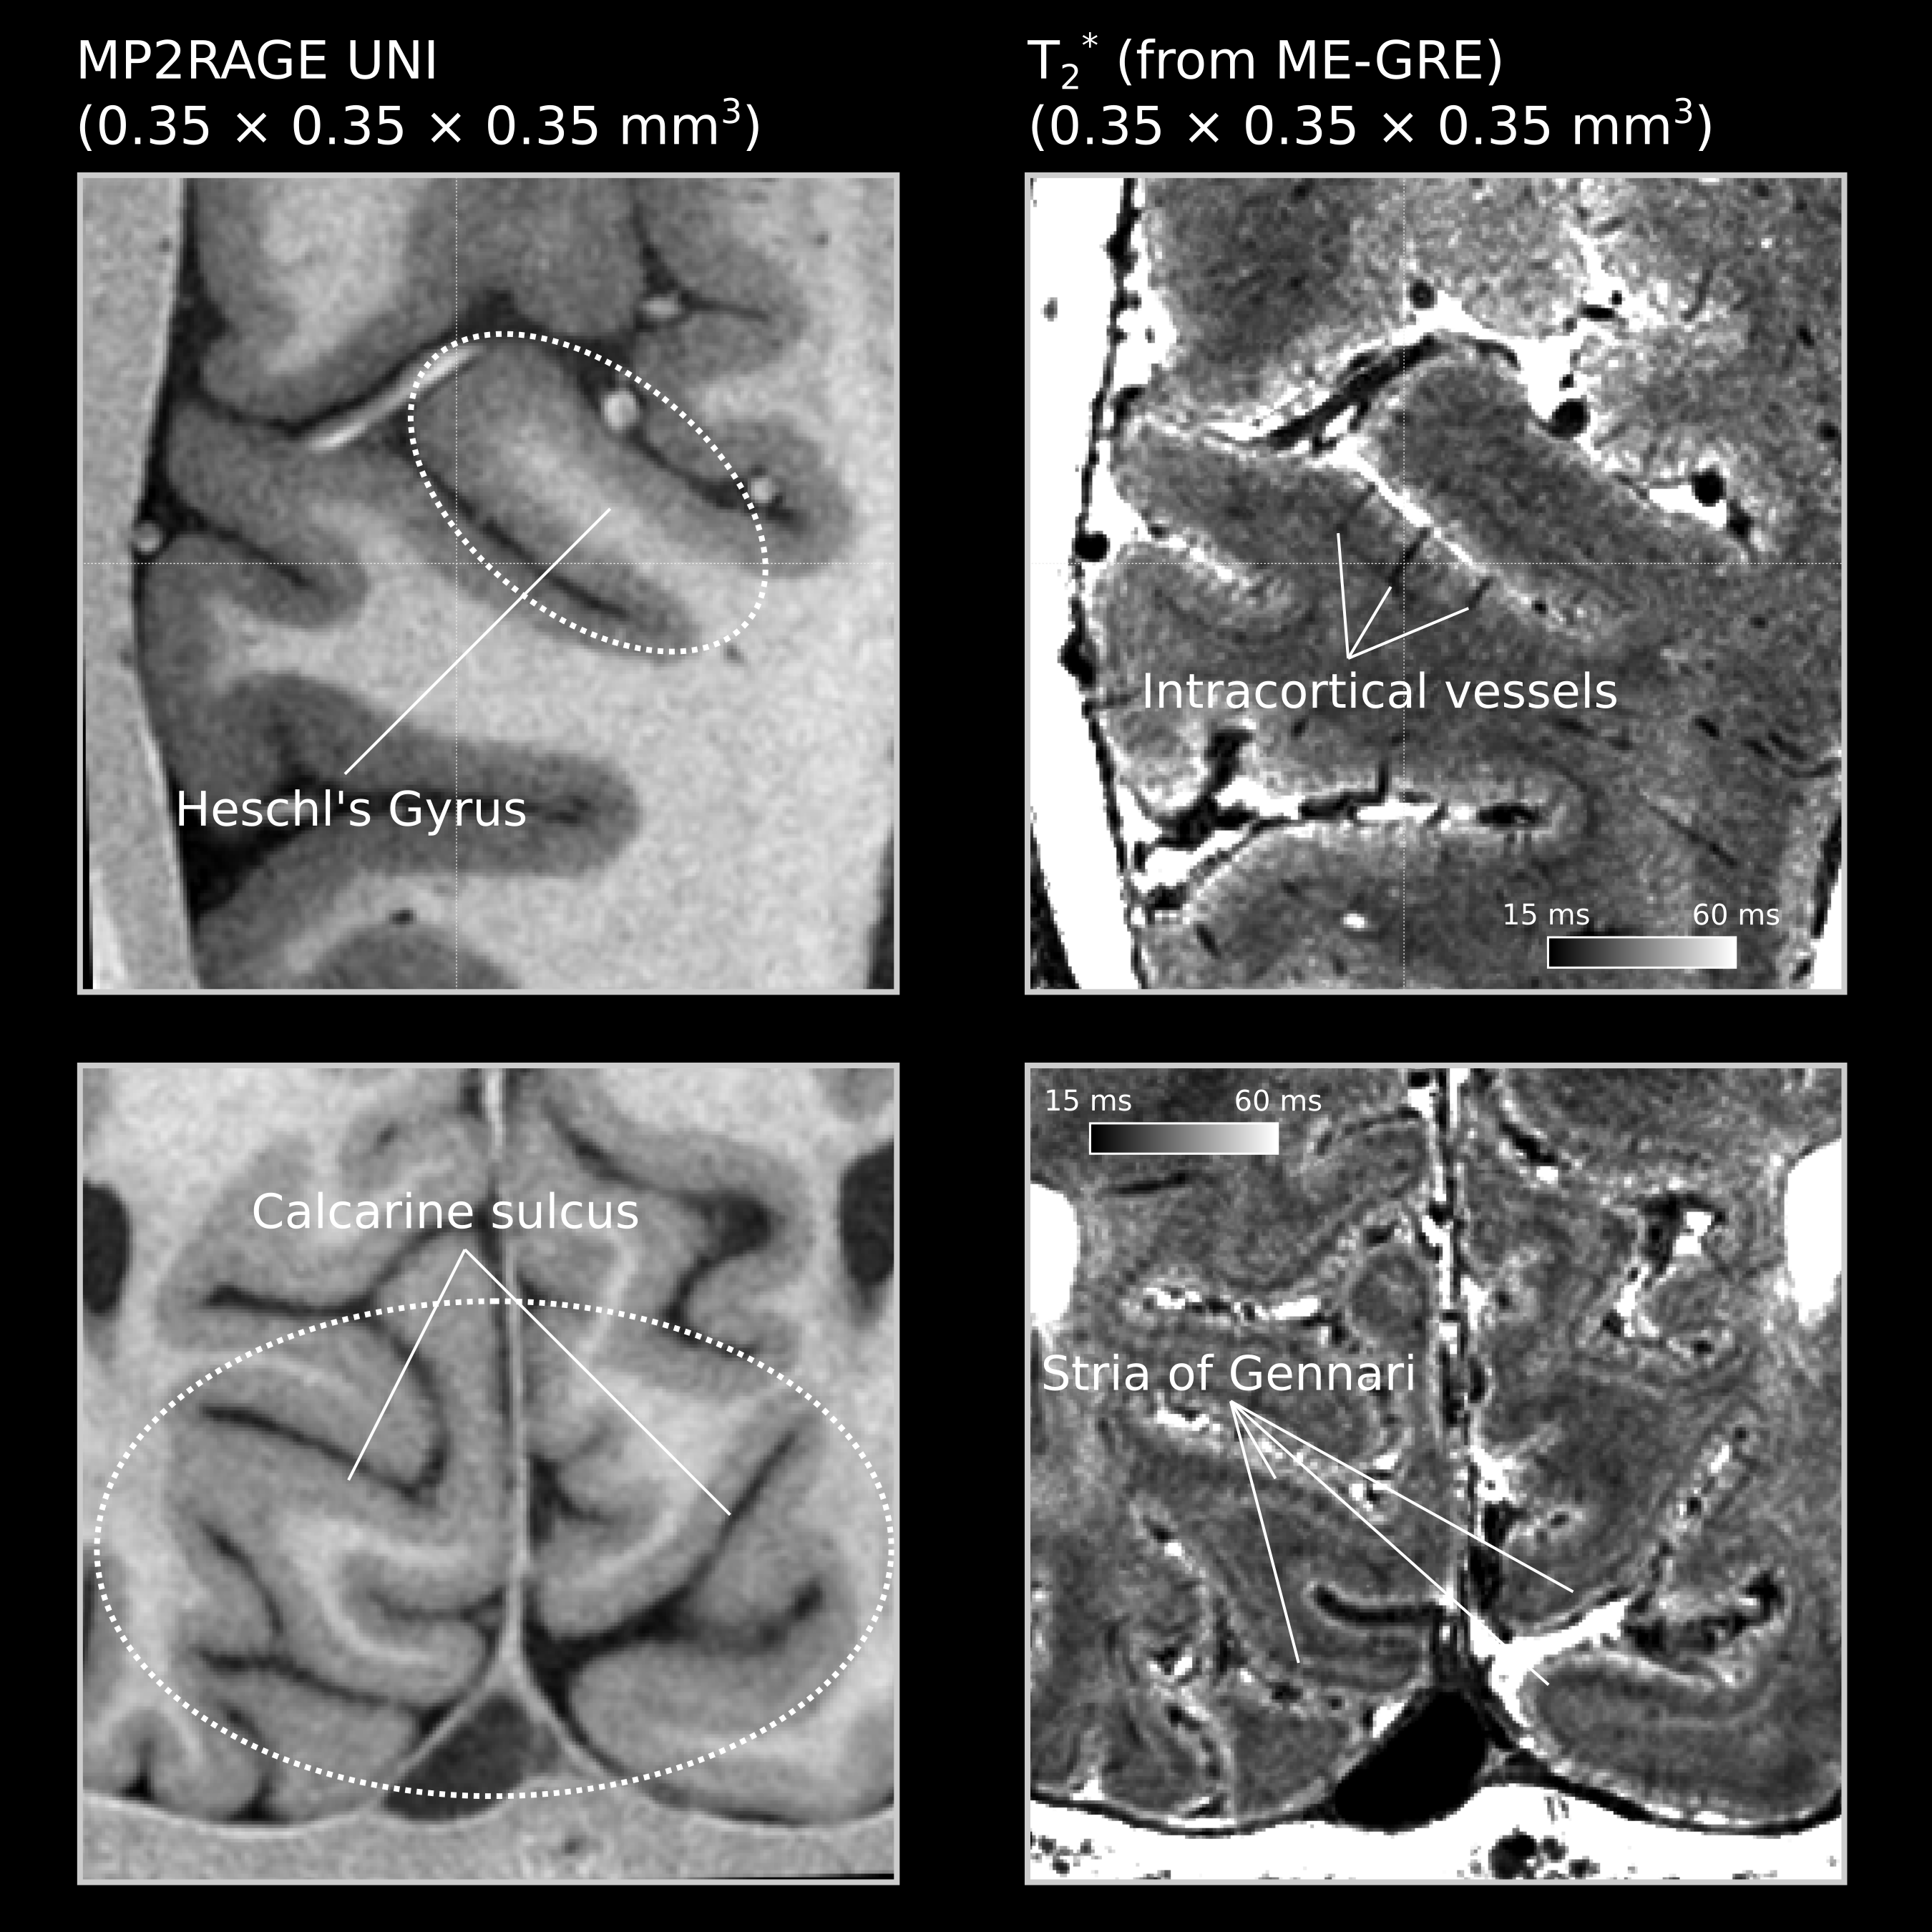
Figure 2. Top row shows a zoomed-in image around Heschl's gyrus. Bottom row shows a zoomed-in image around the calcarine sulcus. Left column shows MP2RAGE UNI contrasts and right column shows T2* measurements obtained from ME-GRE.
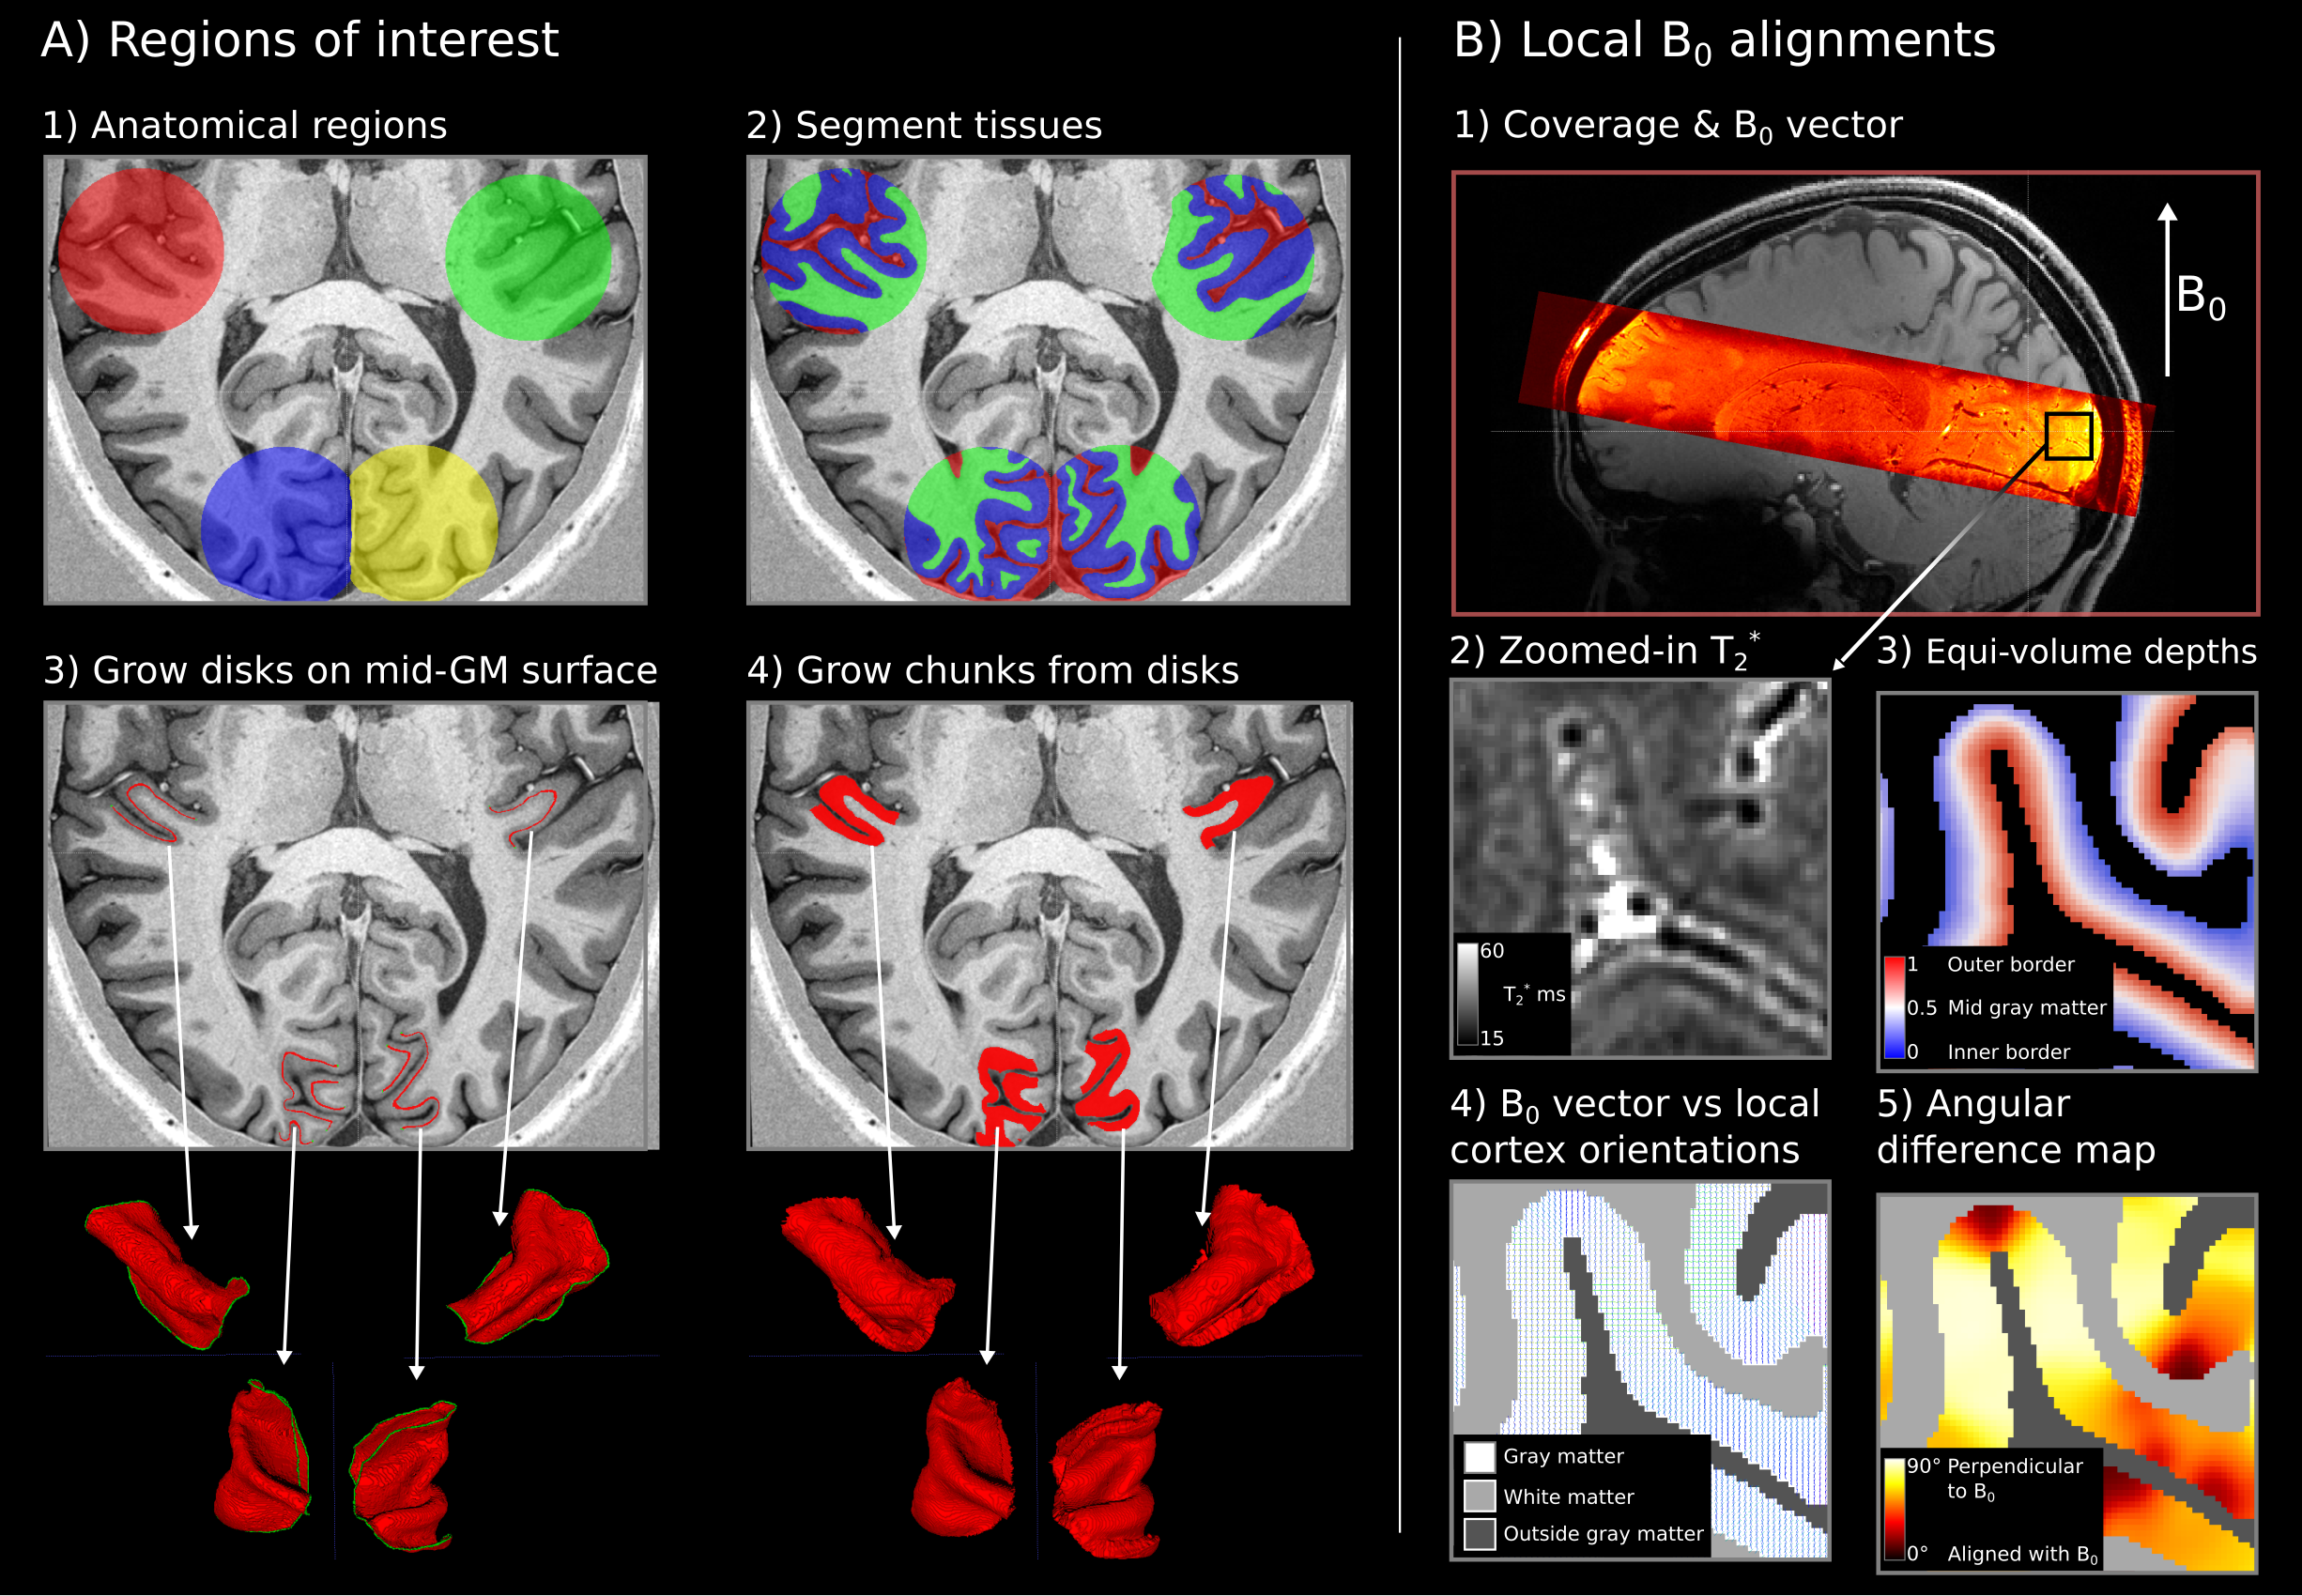
Figure 3. A) Showing steps for generating our regions of interest centered around the primary auditory and visual cortices. B) showing steps for the depth metrics and B0 alignment.