Allen A Champagne1,2 and Alex A Bhogal3
1School of Medicine, Queen's University, Kingston, ON, Canada, 2Center for Neuroscience Studies, Queen's University, Kingston, ON, Canada, 3Radiology, University Medical Center Utrecht, Utrecht, Netherlands
1School of Medicine, Queen's University, Kingston, ON, Canada, 2Center for Neuroscience Studies, Queen's University, Kingston, ON, Canada, 3Radiology, University Medical Center Utrecht, Utrecht, Netherlands
The cerebrovascular response to hypercapnia is driven by factors including CO2 sensitivity, blood flow (re)distribution effects, which together, emphasize the importance temporal analysis for improving the management of vascular brain diseases.
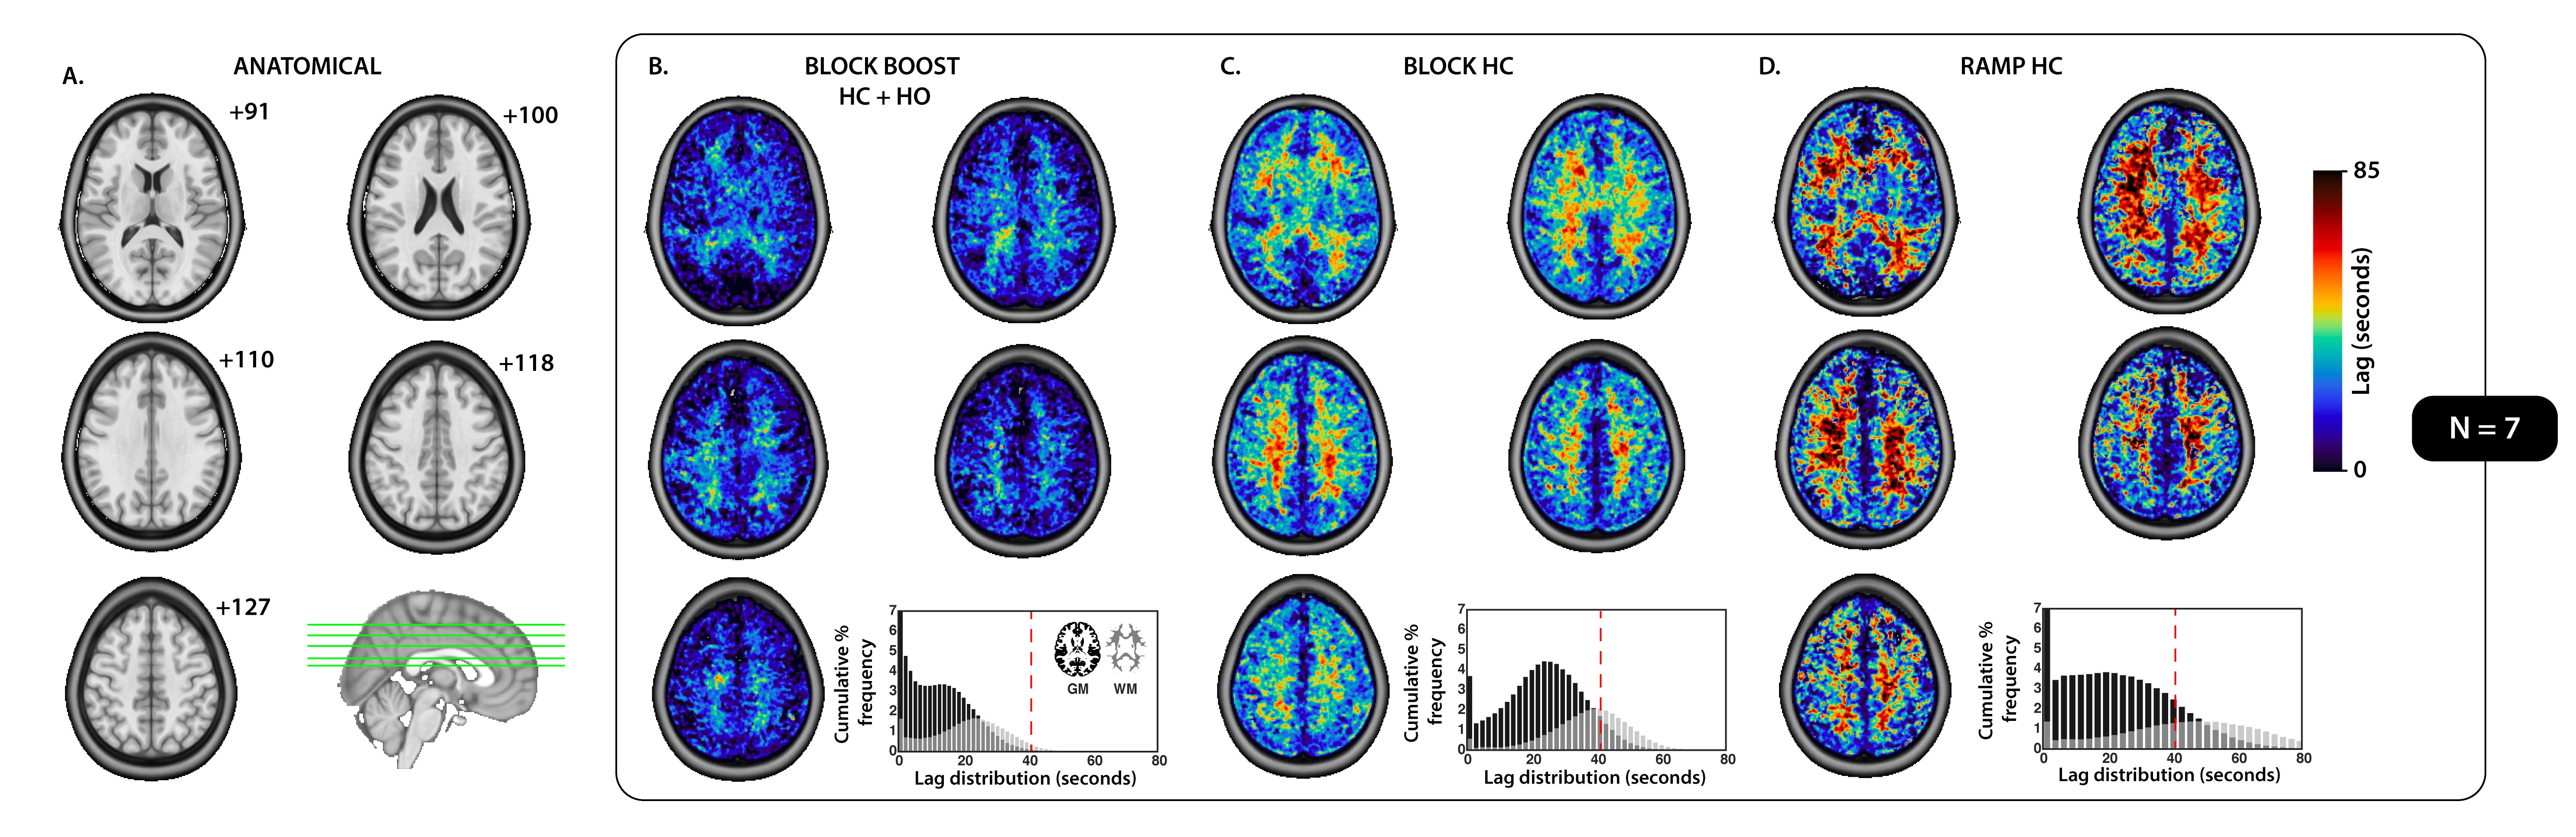
Figure 2. Tissue-based distribution of lag parameters for each respiratory design
(A) Refence anatomical axial slices in MNI space. (B-D) Averaged lag maps (seconds). The cumulative percent frequency (normalized to 100%) for the distribution of lag (seconds) is shown for each tissue which was extracted using the grey- (black) and white- (grey) matter mask displayed in (B), bottom right corner. A dotted red line was added to each histogram (B-D) at 40 seconds, for reference and comparison.
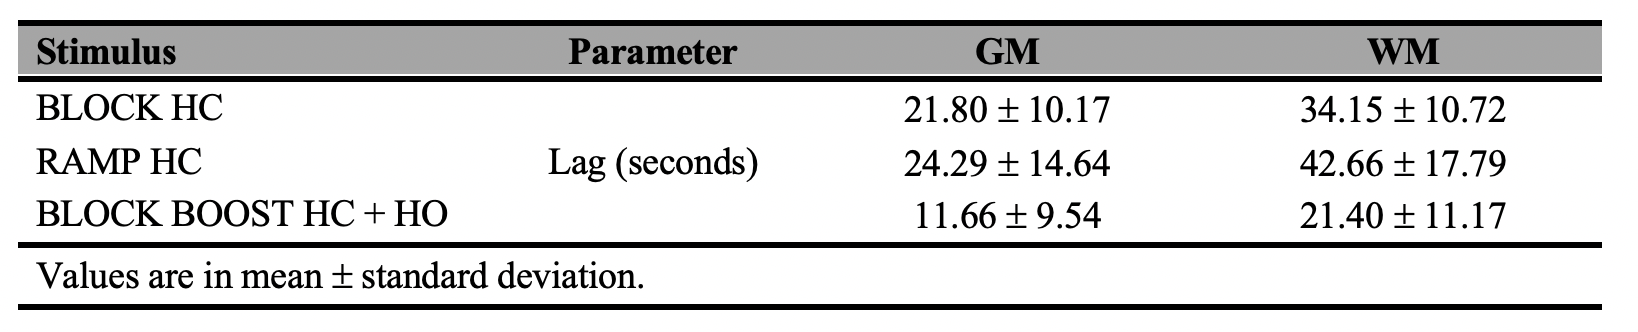
Figure 1. Grey- and white-matter average CVR lag times for each stimulus