Caroline Colbert1, Michael A. Thomas2, Ran Yan3, Aleksandra Radjenovic4, J. Paul Finn1,5, Peng Hu1,3,5, and Kim-Lien Nguyen1,2,5
1Physics and Biology in Medicine Graduate Program, David Geffen School of Medicine at UCLA, Los Angeles, CA, United States, 2Division of Cardiology, UCLA David Geffen School of Medicine, Los Angeles, CA, United States, 3Department of Radiology, UCLA David Geffen School of Medicine, Los Angeles, CA, United States, 4Institute of Cardiovascular & Medical Sciences, College of Medical, Veterinary and Life Sciences, University of Glasgow, Glasgow, United Kingdom, 5Diagnostic Cardiovascular Imaging Laboratory, Department of Radiological Sciences, UCLA David Geffen School of Medicine, Los Angeles, CA, United States
1Physics and Biology in Medicine Graduate Program, David Geffen School of Medicine at UCLA, Los Angeles, CA, United States, 2Division of Cardiology, UCLA David Geffen School of Medicine, Los Angeles, CA, United States, 3Department of Radiology, UCLA David Geffen School of Medicine, Los Angeles, CA, United States, 4Institute of Cardiovascular & Medical Sciences, College of Medical, Veterinary and Life Sciences, University of Glasgow, Glasgow, United Kingdom, 5Diagnostic Cardiovascular Imaging Laboratory, Department of Radiological Sciences, UCLA David Geffen School of Medicine, Los Angeles, CA, United States
Healthy normal swine showed
a mean mid-ventricular fMBV of 7.2 ± 1.4%. This study demonstrates the
feasibility of fMBV estimation using multi-dose FE‑MRI with a two-compartment
water exchange model.
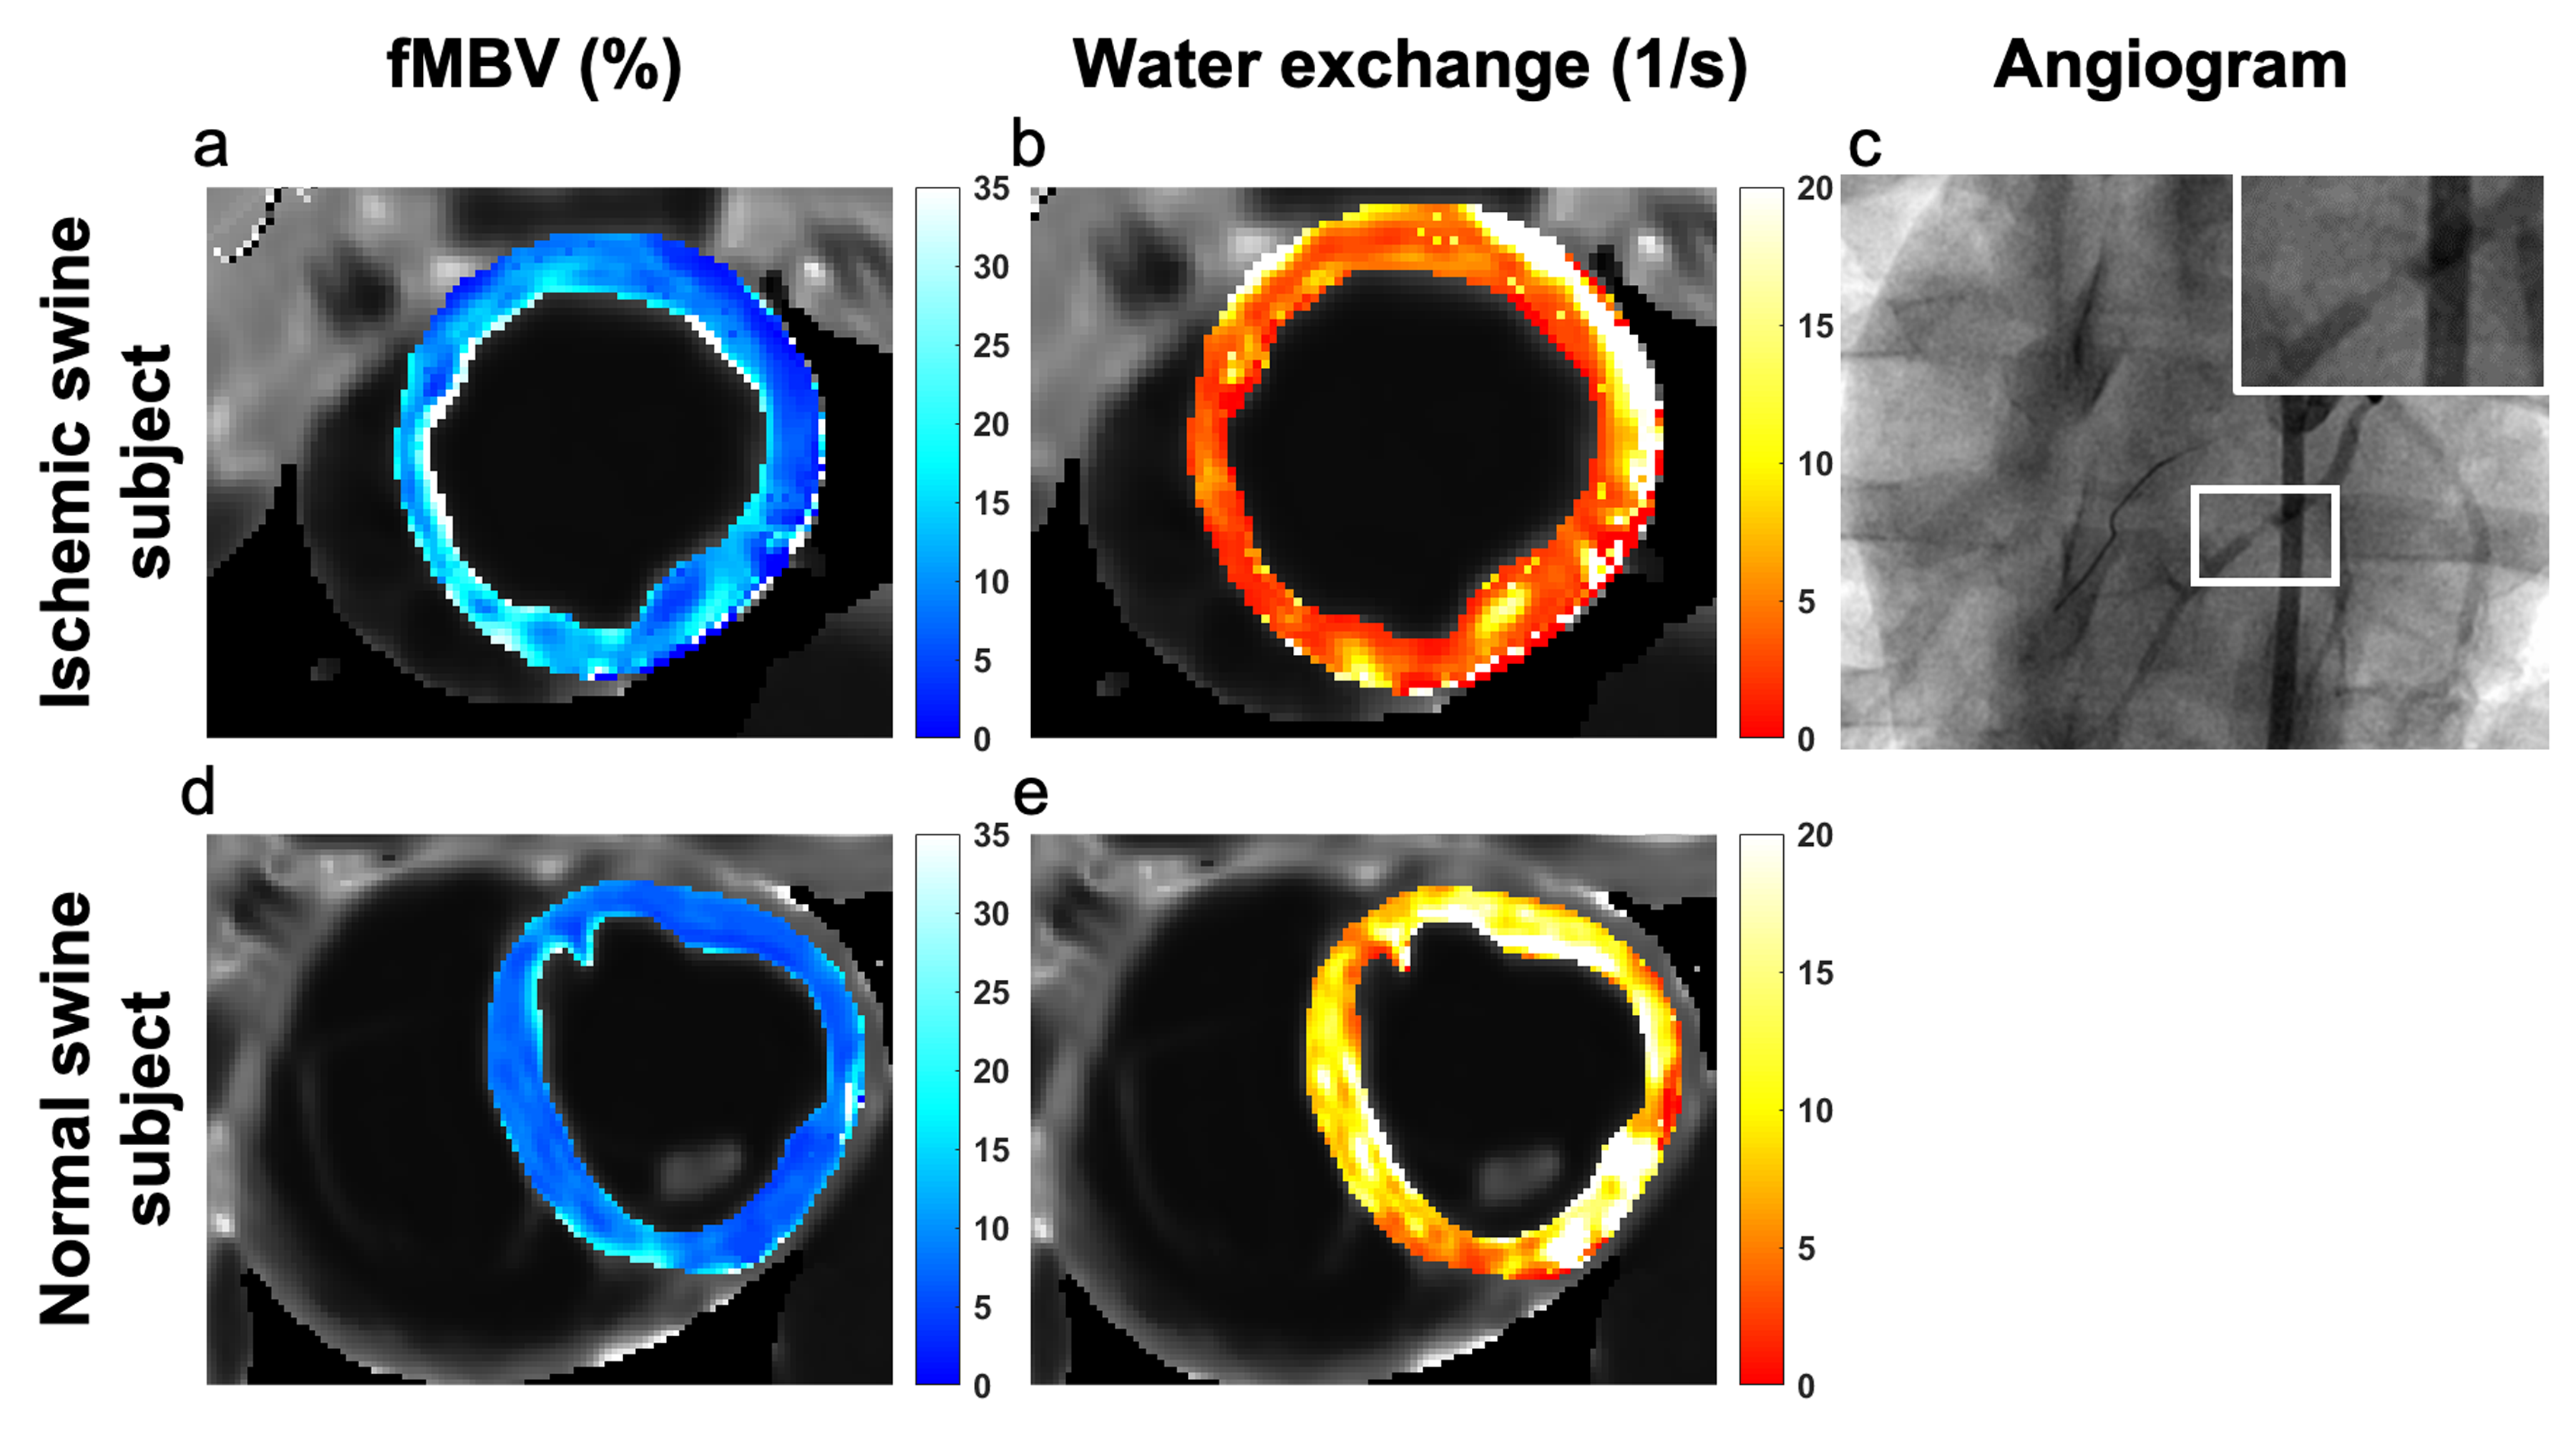
Figure 2. Pixelwise
fMBV and water exchange maps in a swine model of regional myocardial
hypoperfusion (a, b) and a normal swine subject (d, e). In the swine subject
with artificially induced coronary stenosis (top panel), differences in fMBV
(a) and water exchange (b) can be observed in the hypoperfused anterior,
septal, and inferior segments. Angiographic image (c) acquired following
deployment of a 3D printed coronary implant in the mid LAD shows severe
coronary narrowing.
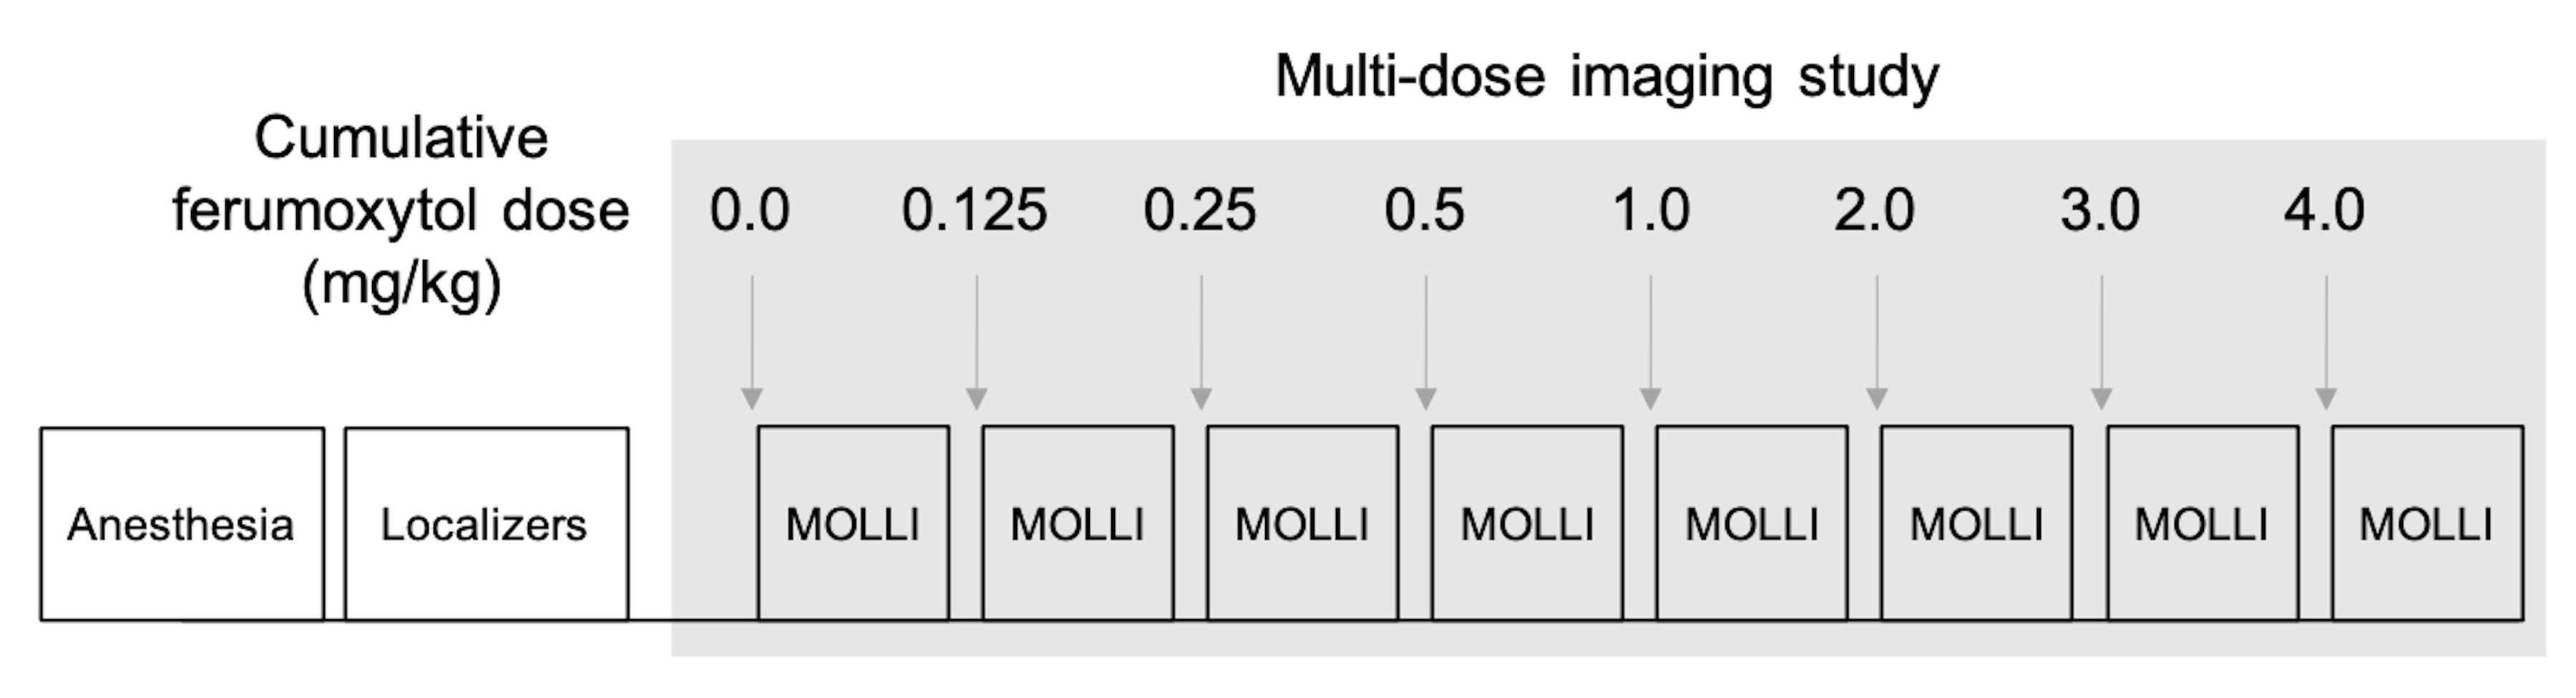
Figure 1. Ferumoxytol
multi-dose T1 mapping study protocol. Following anesthesia and localizers, we
acquired mid-ventricular short axis T1 maps at eight cumulative ferumoxytol
doses (0.0 – 4.0 mg/kg). Following each ferumoxytol infusion, we observed a
five-minute delay to achieve contrast steady state. MOLLI, Modified Look-Locker
Inversion.