Nikos Priovoulos1, Mads Andersen2, Vincent O Boer3, and Wietske van der Zwaag1
1Spinoza Center, Amsterdam, Netherlands, 2Philips Healthcare, Copenhagen, Denmark, 3Danish Research Centre for Magnetic Resonance, Centre for Functional and Diagnostic Imaging and Research, Copenhagen University Hospital, Hvidovre, Denmark
1Spinoza Center, Amsterdam, Netherlands, 2Philips Healthcare, Copenhagen, Denmark, 3Danish Research Centre for Magnetic Resonance, Centre for Functional and Diagnostic Imaging and Research, Copenhagen University Hospital, Hvidovre, Denmark
Cerebellar cortical layers can be reproducibly visualized at 7Tesla by interleaving a susceptibility-weighted FLASH sequence with fat-navigator based prospective motion correction in MRI-naïve individuals.
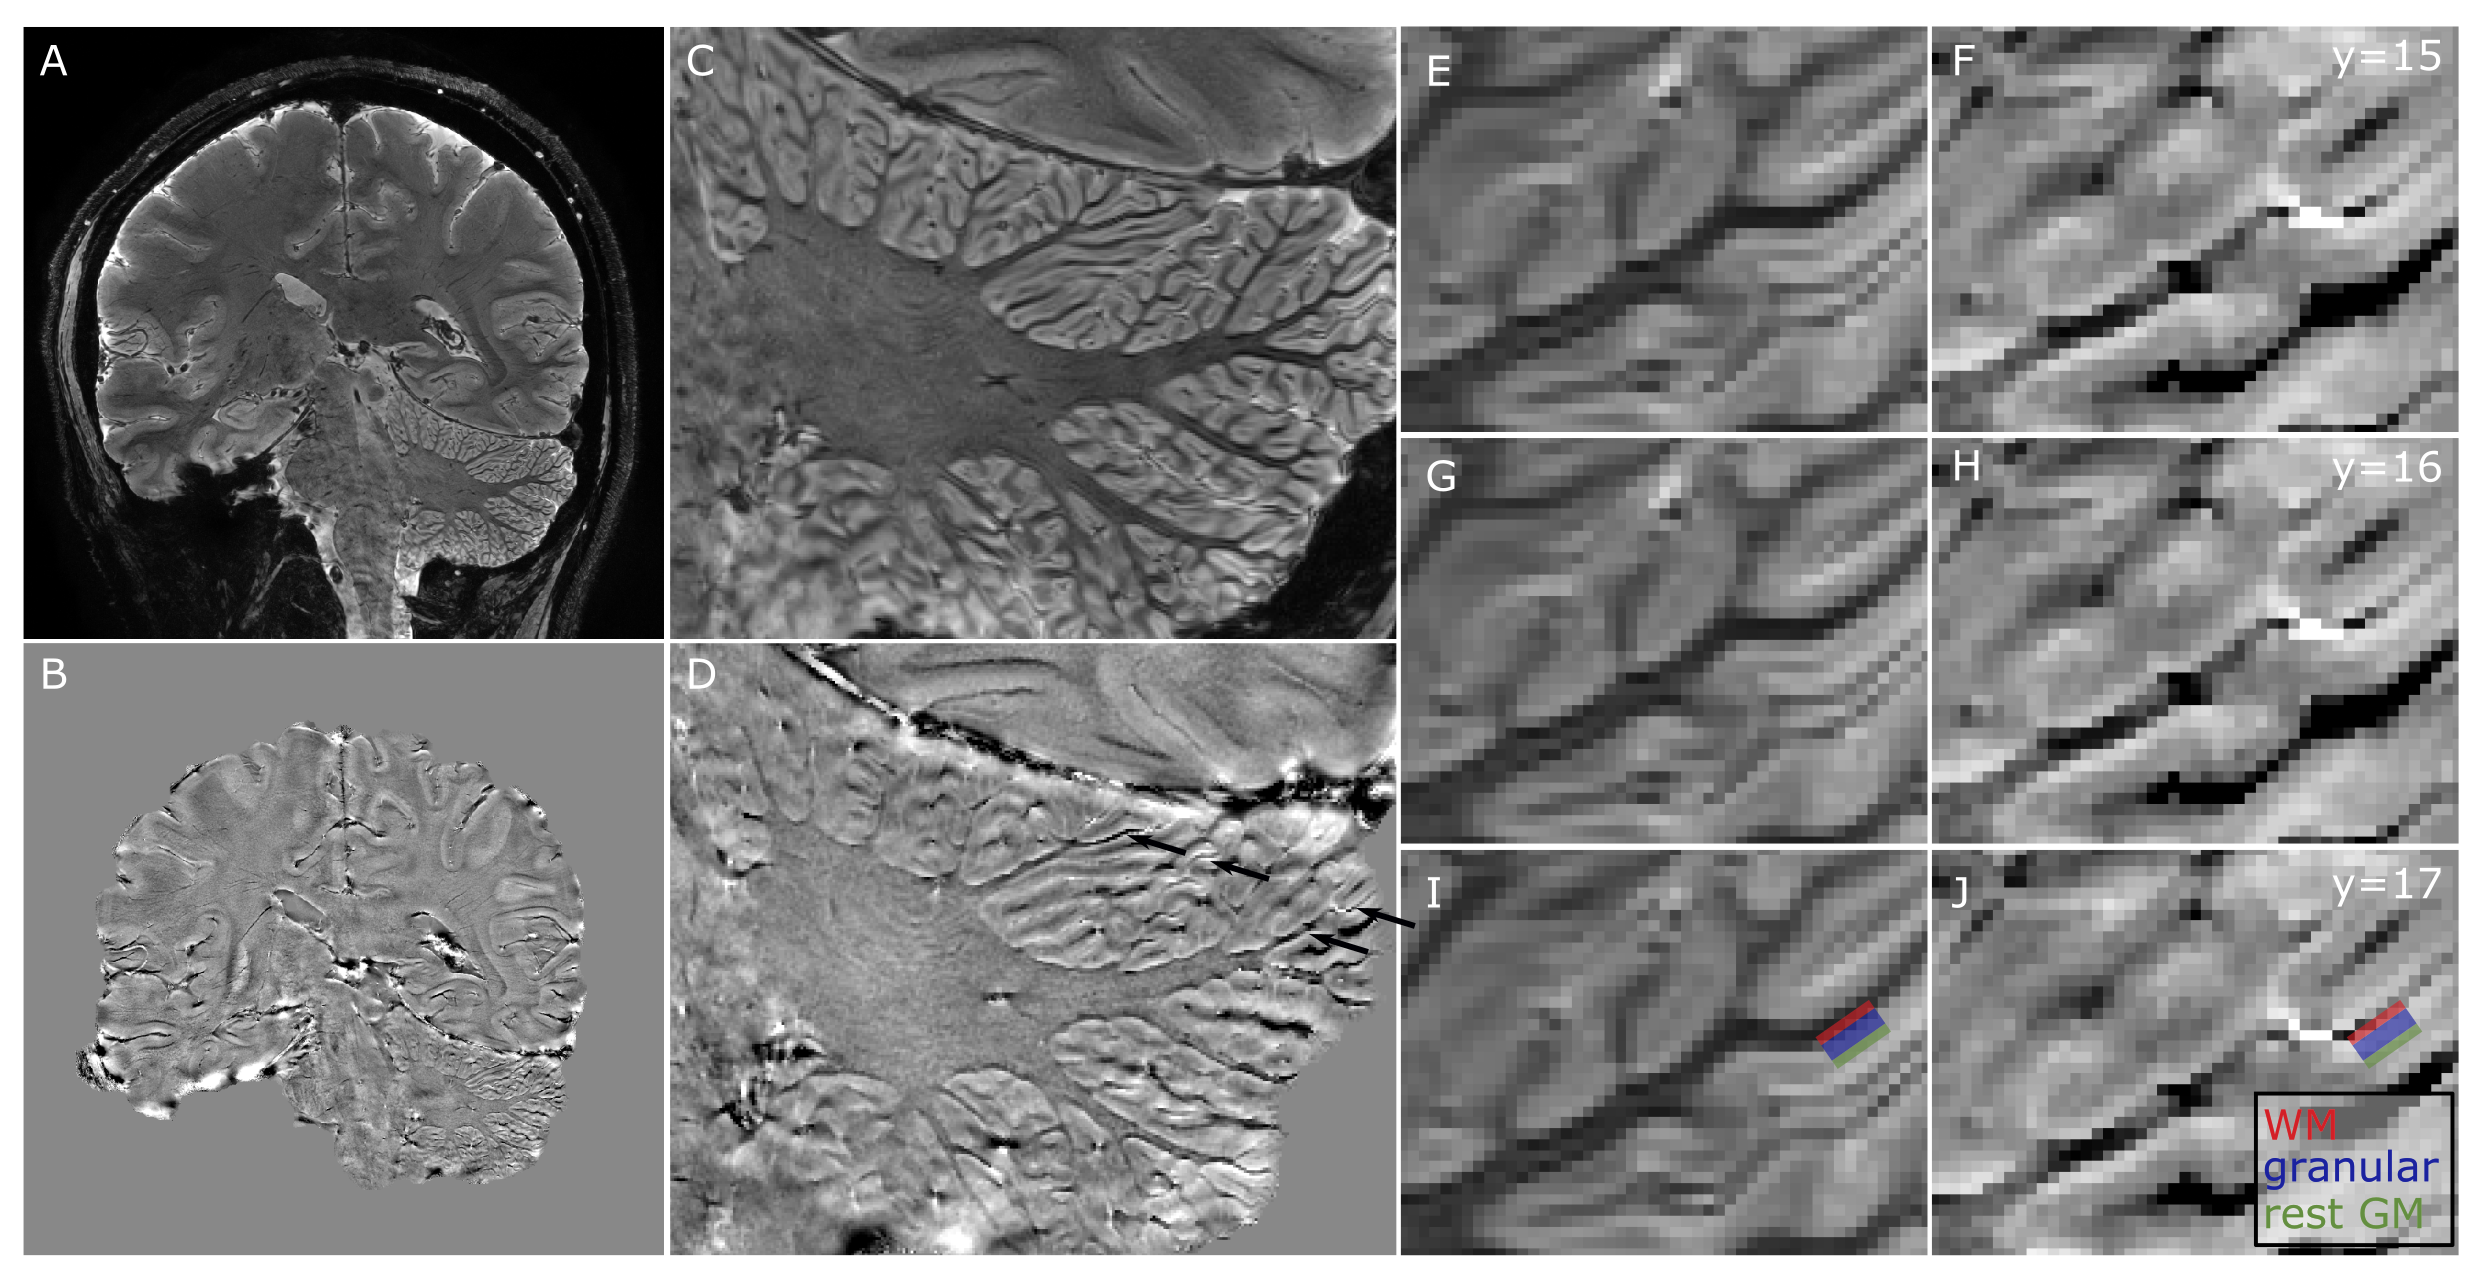
Figure 4: Magnitude (A) and phase (B) sagittal slices of the cerebellum. C-D, zoomed views. Note the white stripes in D (examples with black arrows), next to the WM, as reported before in2. These stripes were consistent across successive slices (E,G,I: magnitude, F,H,J: phase) and are likely to be the granular ceberellar layer. Note they fell within the cerebellar gray matter, as seen in the magnitude image (blue bar in I,J).
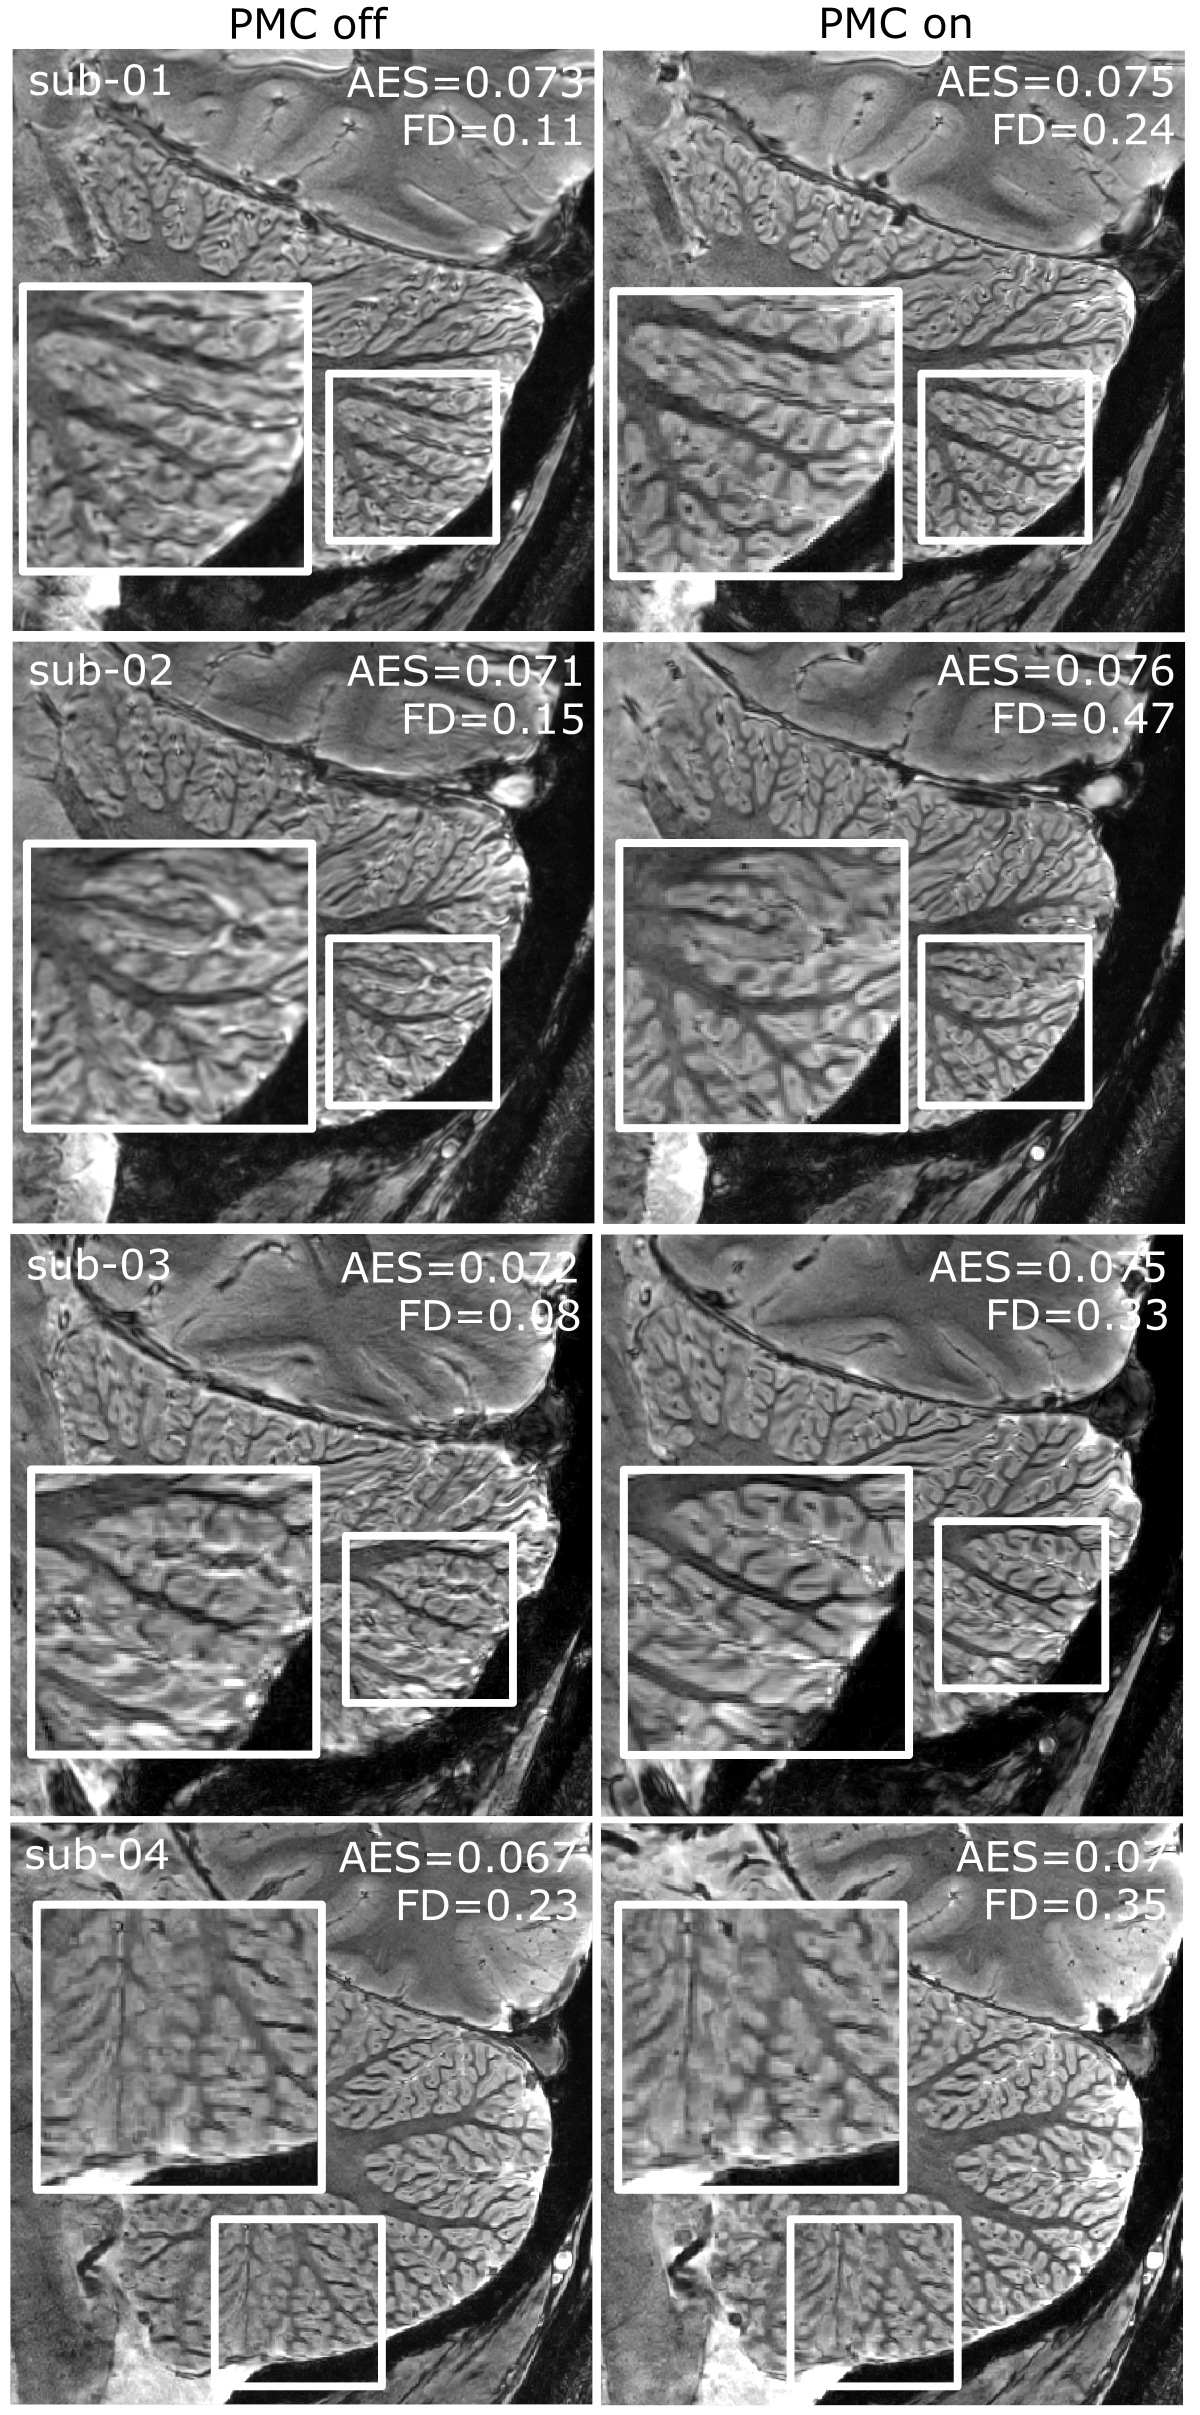
Figure 2: Sagittal slices of the cerebellum (magnitude image; 0.2x0.2mm2 in-plane resolution). Each row is a participant; left column: PMC off, right column: PMC on. The white boxes show zoomed views of the cerebellum. AES (average edge strength) is a measure of sharpness; FD (framewise-displacement) is a measure of shot-to-shot motion as determined posthoc by the fat-navigators. Note the marked improvements in image quality when using PMC.