Ben R Dickie1,2, Tao Jin3, Rainer Hinz4, Geoff JM Parker5,6, Laura M Parkes1,2, and Julian Matthews1,2
1Division of Neuroscience and Experimental Psychology, Faculty of Biology Medicine and Health, The University of Manchester, Manchester, United Kingdom, 2Geoffrey Jefferson Brain Research Centre, Manchester Academic Health Science Centre, Manchester, United Kingdom, 3Department of Radiology, University of Pittsburgh, Pittsburgh, PA, United States, 4Division of Informatics, Imaging, and Data Sciences, Faculty of Biology, Medicine, and Health, The University of Manchester, Manchester, United Kingdom, 5Centre for Medical Image Computing, Department of Computer Science and Department of Neuroinflammation, University College London, London, United Kingdom, 6Bioxydyn Ltd, Manchester, United Kingdom
1Division of Neuroscience and Experimental Psychology, Faculty of Biology Medicine and Health, The University of Manchester, Manchester, United Kingdom, 2Geoffrey Jefferson Brain Research Centre, Manchester Academic Health Science Centre, Manchester, United Kingdom, 3Department of Radiology, University of Pittsburgh, Pittsburgh, PA, United States, 4Division of Informatics, Imaging, and Data Sciences, Faculty of Biology, Medicine, and Health, The University of Manchester, Manchester, United Kingdom, 5Centre for Medical Image Computing, Department of Computer Science and Department of Neuroinflammation, University College London, London, United Kingdom, 6Bioxydyn Ltd, Manchester, United Kingdom
Kinetic
modelling of glucoCESL MRI data is feasible, and produces high spatial
resolution maps of glucose transport and metabolism.

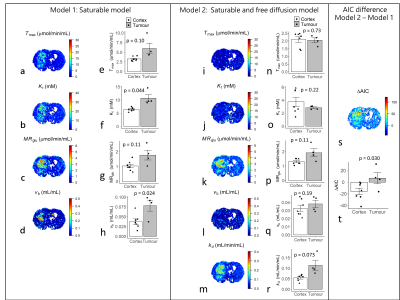
Figure 4. GlucoCESL parameter maps from a tumour bearing rat
using model 1 (a-d) and model 2 (i-m), and mean parameter values in cortex
(healthy – triangle; tumour bearing – circle; n = 7) and tumour (n = 4) for
model 1 (e-h) and model 2 (n-r). Far right is the corresponding ΔAIC map (s)
and mean ΔAIC in cortex and tumour (t). T-tests for partially overlapping
samples were used to test the null hypothesis of no difference in parameter
values between cortex and tumour.

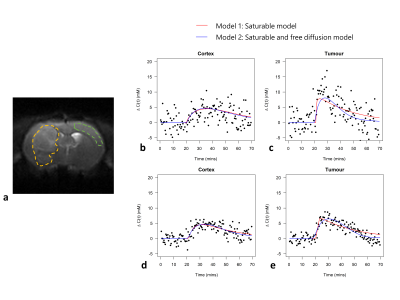
Figure 3. a) An example CESL image acquired with TSL = 0.
These images are T2-weighted and provide excellent contrast for definition of
tumour (yellow) and cortex (green) ROIs which were drawn manually in MRIcron. Example voxelwise data and kinetic model fits in the cortex (b) and tumour
(c). Example ROI averaged data and fits in the cortex (d) and tumour (e). Both
models provide a good fit to cortex data. Model 2 appears to provide a better
fit to tumour data.
