Maximilian Gram1,2, Daniel Gensler1,3, Patrick Winter1,2, Fabian Gutjahr2,3, Michael Seethaler2,3, Peter Michael Jakob2, and Peter Nordbeck1,3
1Department of Internal Medicine I, University Hospital Würzburg, Würzburg, Germany, 2Experimental Physics 5, University of Würzburg, Würzburg, Germany, 3Comprehensive Heart Failure Center (CHFC), University Hospital Würzburg, Würzburg, Germany
1Department of Internal Medicine I, University Hospital Würzburg, Würzburg, Germany, 2Experimental Physics 5, University of Würzburg, Würzburg, Germany, 3Comprehensive Heart Failure Center (CHFC), University Hospital Würzburg, Würzburg, Germany
The quantification of T1ρ using fast gradient echo sequences leads to a contamination of the T1ρ relaxation pathway. In consequence, quantification errors arise depending on T1 and the sequence parameters used. Therefore, we present a formalism for T1ρ* and a subsequent T1ρ correction.

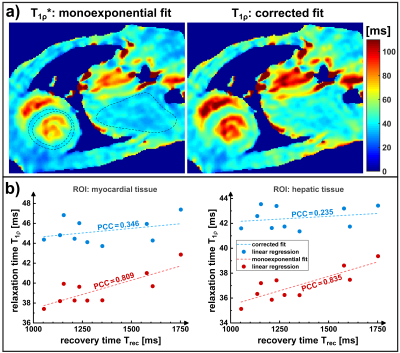
Figure 5) Results of the in vivo measurements on mice (short axis view, isotropic resolution 250μm). In a) maps are shown using monoexponential fitting (left) and corrected fitting (right) for Trec=1275±66ms. The correlation with the different recovery times are shown in b). Here we considered regions of interest in myocardial tissue (left) and hepatic tissue (right). Positive correlation can be observed for monoexponential fitting, while the corrected fit provides a reduced correlation. The T1 in myocardial tissue was 1388±51ms. (tSL=4,12,20,28,36,44,52,60ms, fSL=1500Hz)

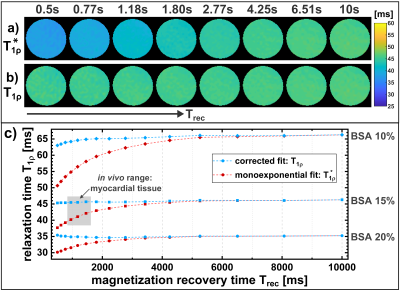
Figure 4) Results of the phantom measurements. In a) and b) the results of T1ρ mapping (BSA 15%) are shown using Eq.1 (monoexponential) and Eq.2 (corrected) respectively. In c) the results are shown for all BSA concentrations. Monoexponential fitting leads to an underestimation of T1ρ for small recovery times. The corrected fit using the corresponding T1 values and recovery times prevents the underestimation. The mean quantification error could be reduced from -7.4% to -1.3%. (tSL=4,17,30,43,56,69,82,95ms, fSL=1500Hz)
