Carlos Velasco1, Gastao Cruz1, René M. Botnar1, and Claudia Prieto1
1School of Biomedical Engineering and Imaging Sciences, King's College London, London, United Kingdom
1School of Biomedical Engineering and Imaging Sciences, King's College London, London, United Kingdom
An 8-echo T1, T2 and T1⍴ prepared liver MRF sequence that allows for quantitative T1, T2, T2*, T1⍴ and fat fraction liver tissue characterization in a single breath-hold scan of ~18s is proposed.
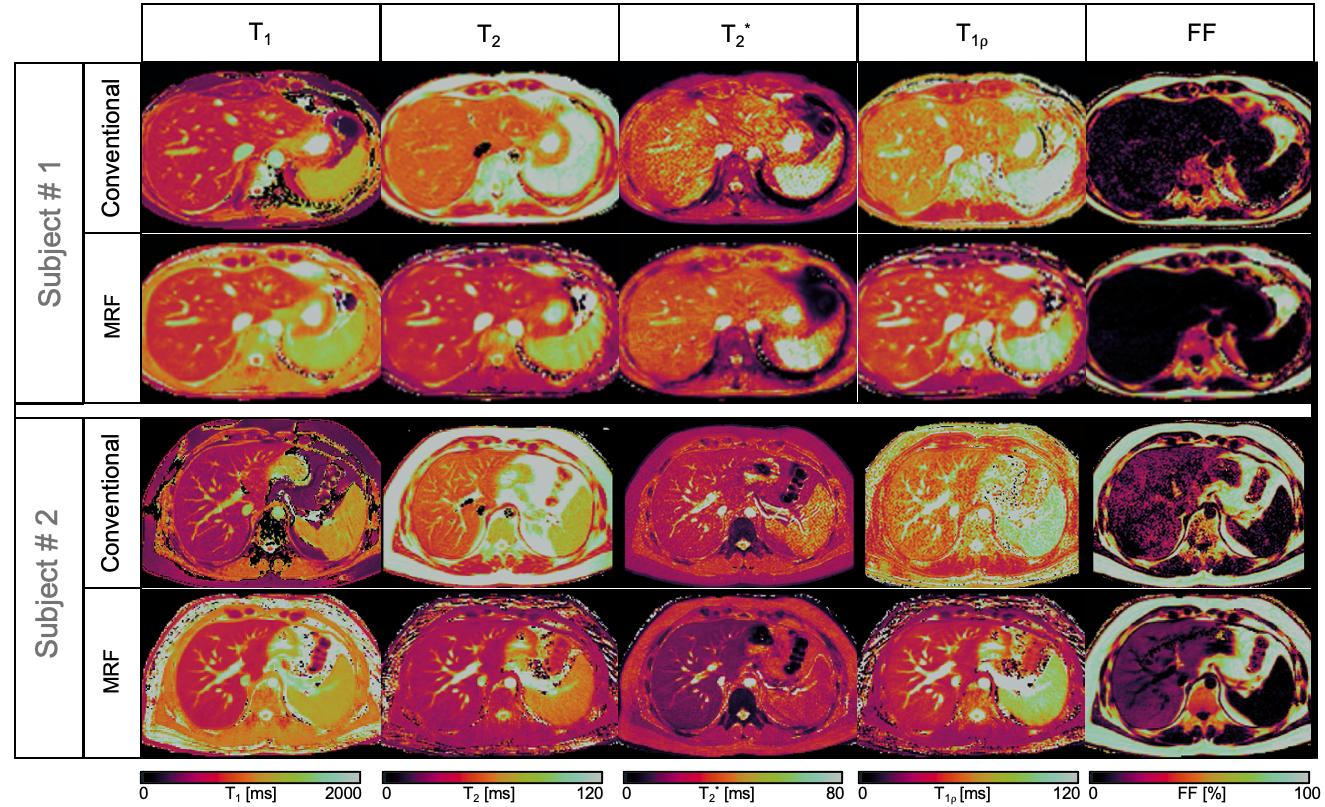
Fig. 2. T1, T2, T2*, T1⍴ and FF maps obtained from a single MRF acquisition with the proposed method (bottom row) compared to the reference maps (top row) in two representative subjects. Subject #2 presented previously diagnosed mild liver steatosis. A mild elevation in liver fat content can be observed in the FF MRF map, and confirmed with the reference method.
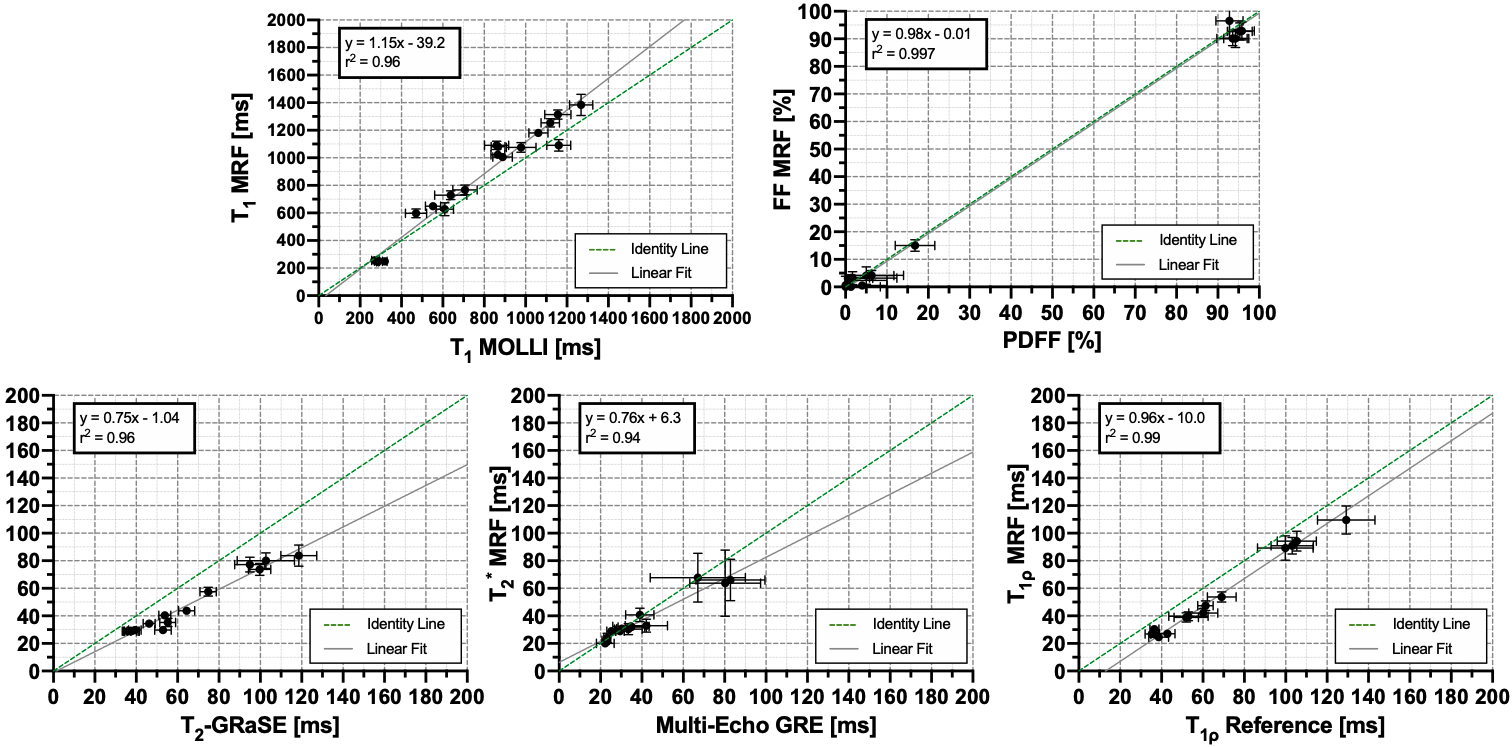
Fig. 4. Scatter plots showing correlation between MRF-derived T1, T2, T2*, T1⍴ and FF and their corresponding reference values. Linear fits (grey lines) show slopes not significantly different from 1.0 (p>0.05) in the cases of T1⍴ and FF quantification. Green dashed line denotes the identity line.