Yanlin Wang1, Shi Tang1, Xinyu Hu1, Yongbo Hu1, Weihong Kuang2, Zhiyun Jia1, Xiaoqi Huang1, and Qiyong Gong1
1Department of Radiology, West China Hospital, Sichuan University, Huaxi MR Research Center (HMRRC), Functional and molecular imaging Key Laboratory of Sichuan Province, Chengdu, China, 2Department of Psychiatry, Sichuan University West China Hospital, Chengdu, China
1Department of Radiology, West China Hospital, Sichuan University, Huaxi MR Research Center (HMRRC), Functional and molecular imaging Key Laboratory of Sichuan Province, Chengdu, China, 2Department of Psychiatry, Sichuan University West China Hospital, Chengdu, China
We
defined
a novel two specific symptoms dominated
subtypes of depression that were underlined by distinct
network patterns, which did not only improve our understanding of heterogeneous
but also lead to the development of leveraging multimodal
data types to define subtypes of depression.
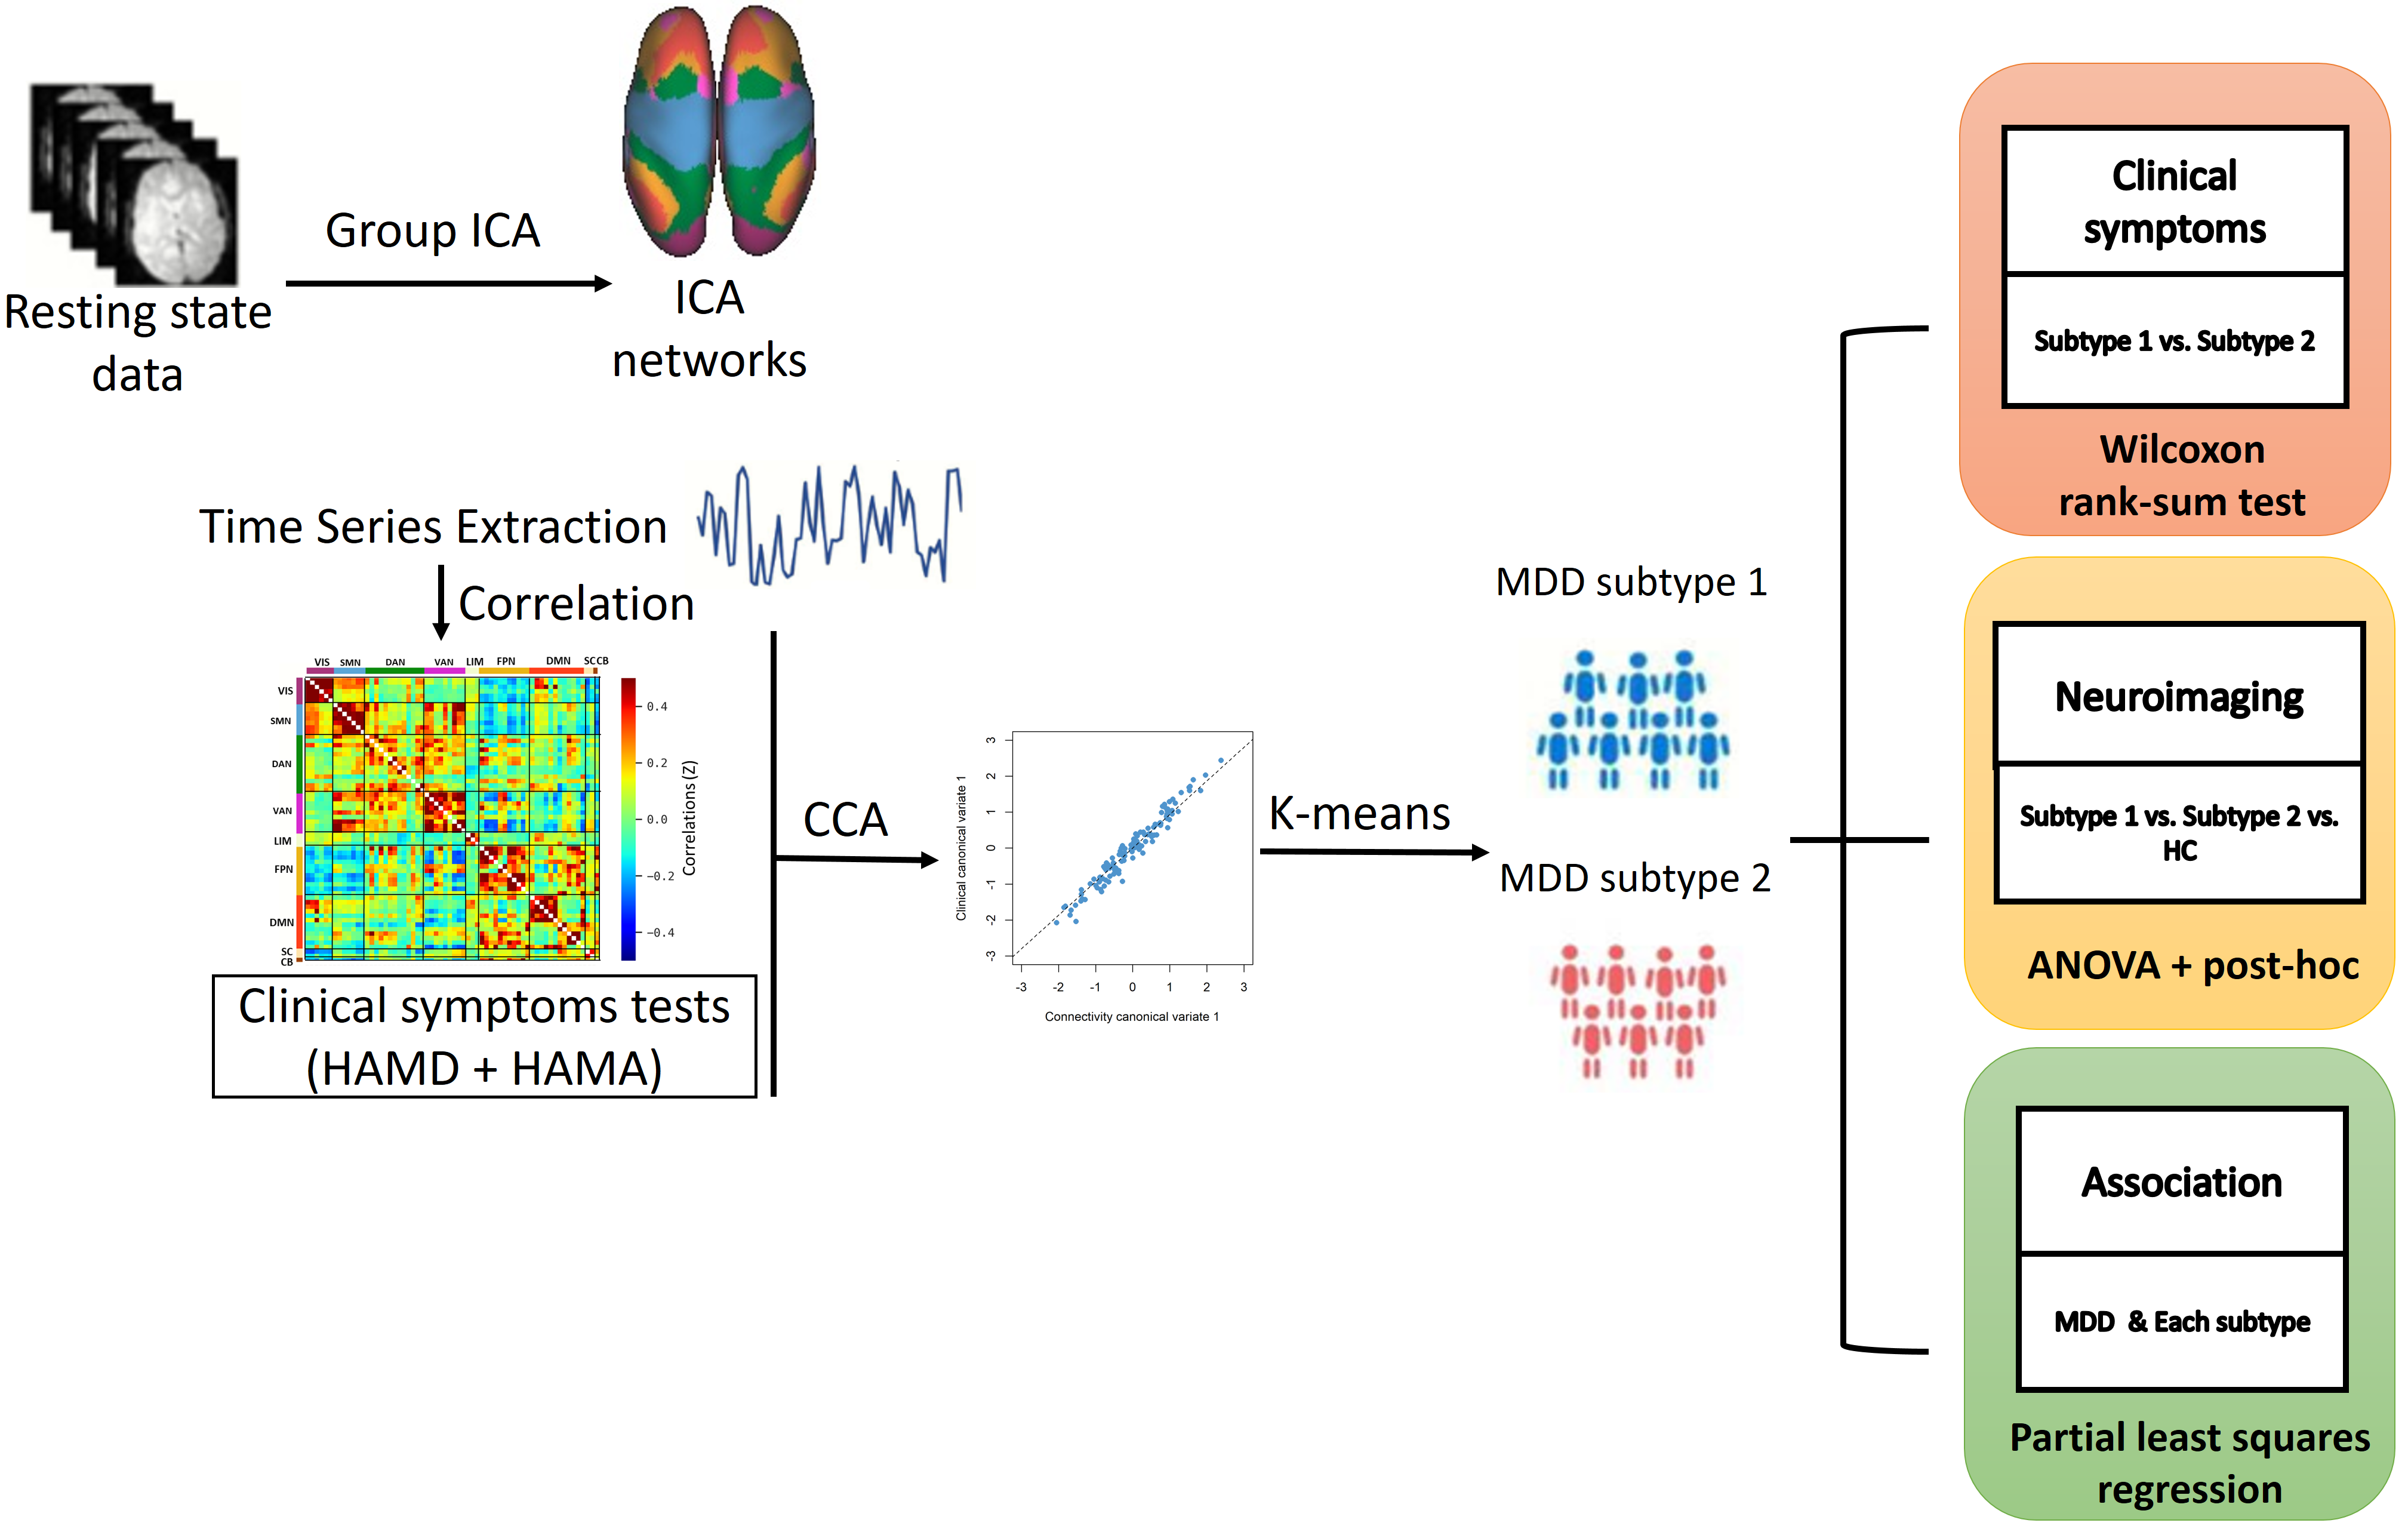
Figure 1. Overview of data processing
and analysis pipeline. Group-ICA was used to calculate and extract the average signal time
series from validated brain parcellations. Following data
reduction were performed by a rCCA. The subtypes of depression were defined by
k-means clustering based on combination of neuroimaging and clinical data. Finally,
group comparisons of ICNs and clinical symptoms between each subgroup and HC
were implemented a one-way ANOVA analysis, respectively. PLSR analysis was
employed to assess the association between these features in each subgroup.
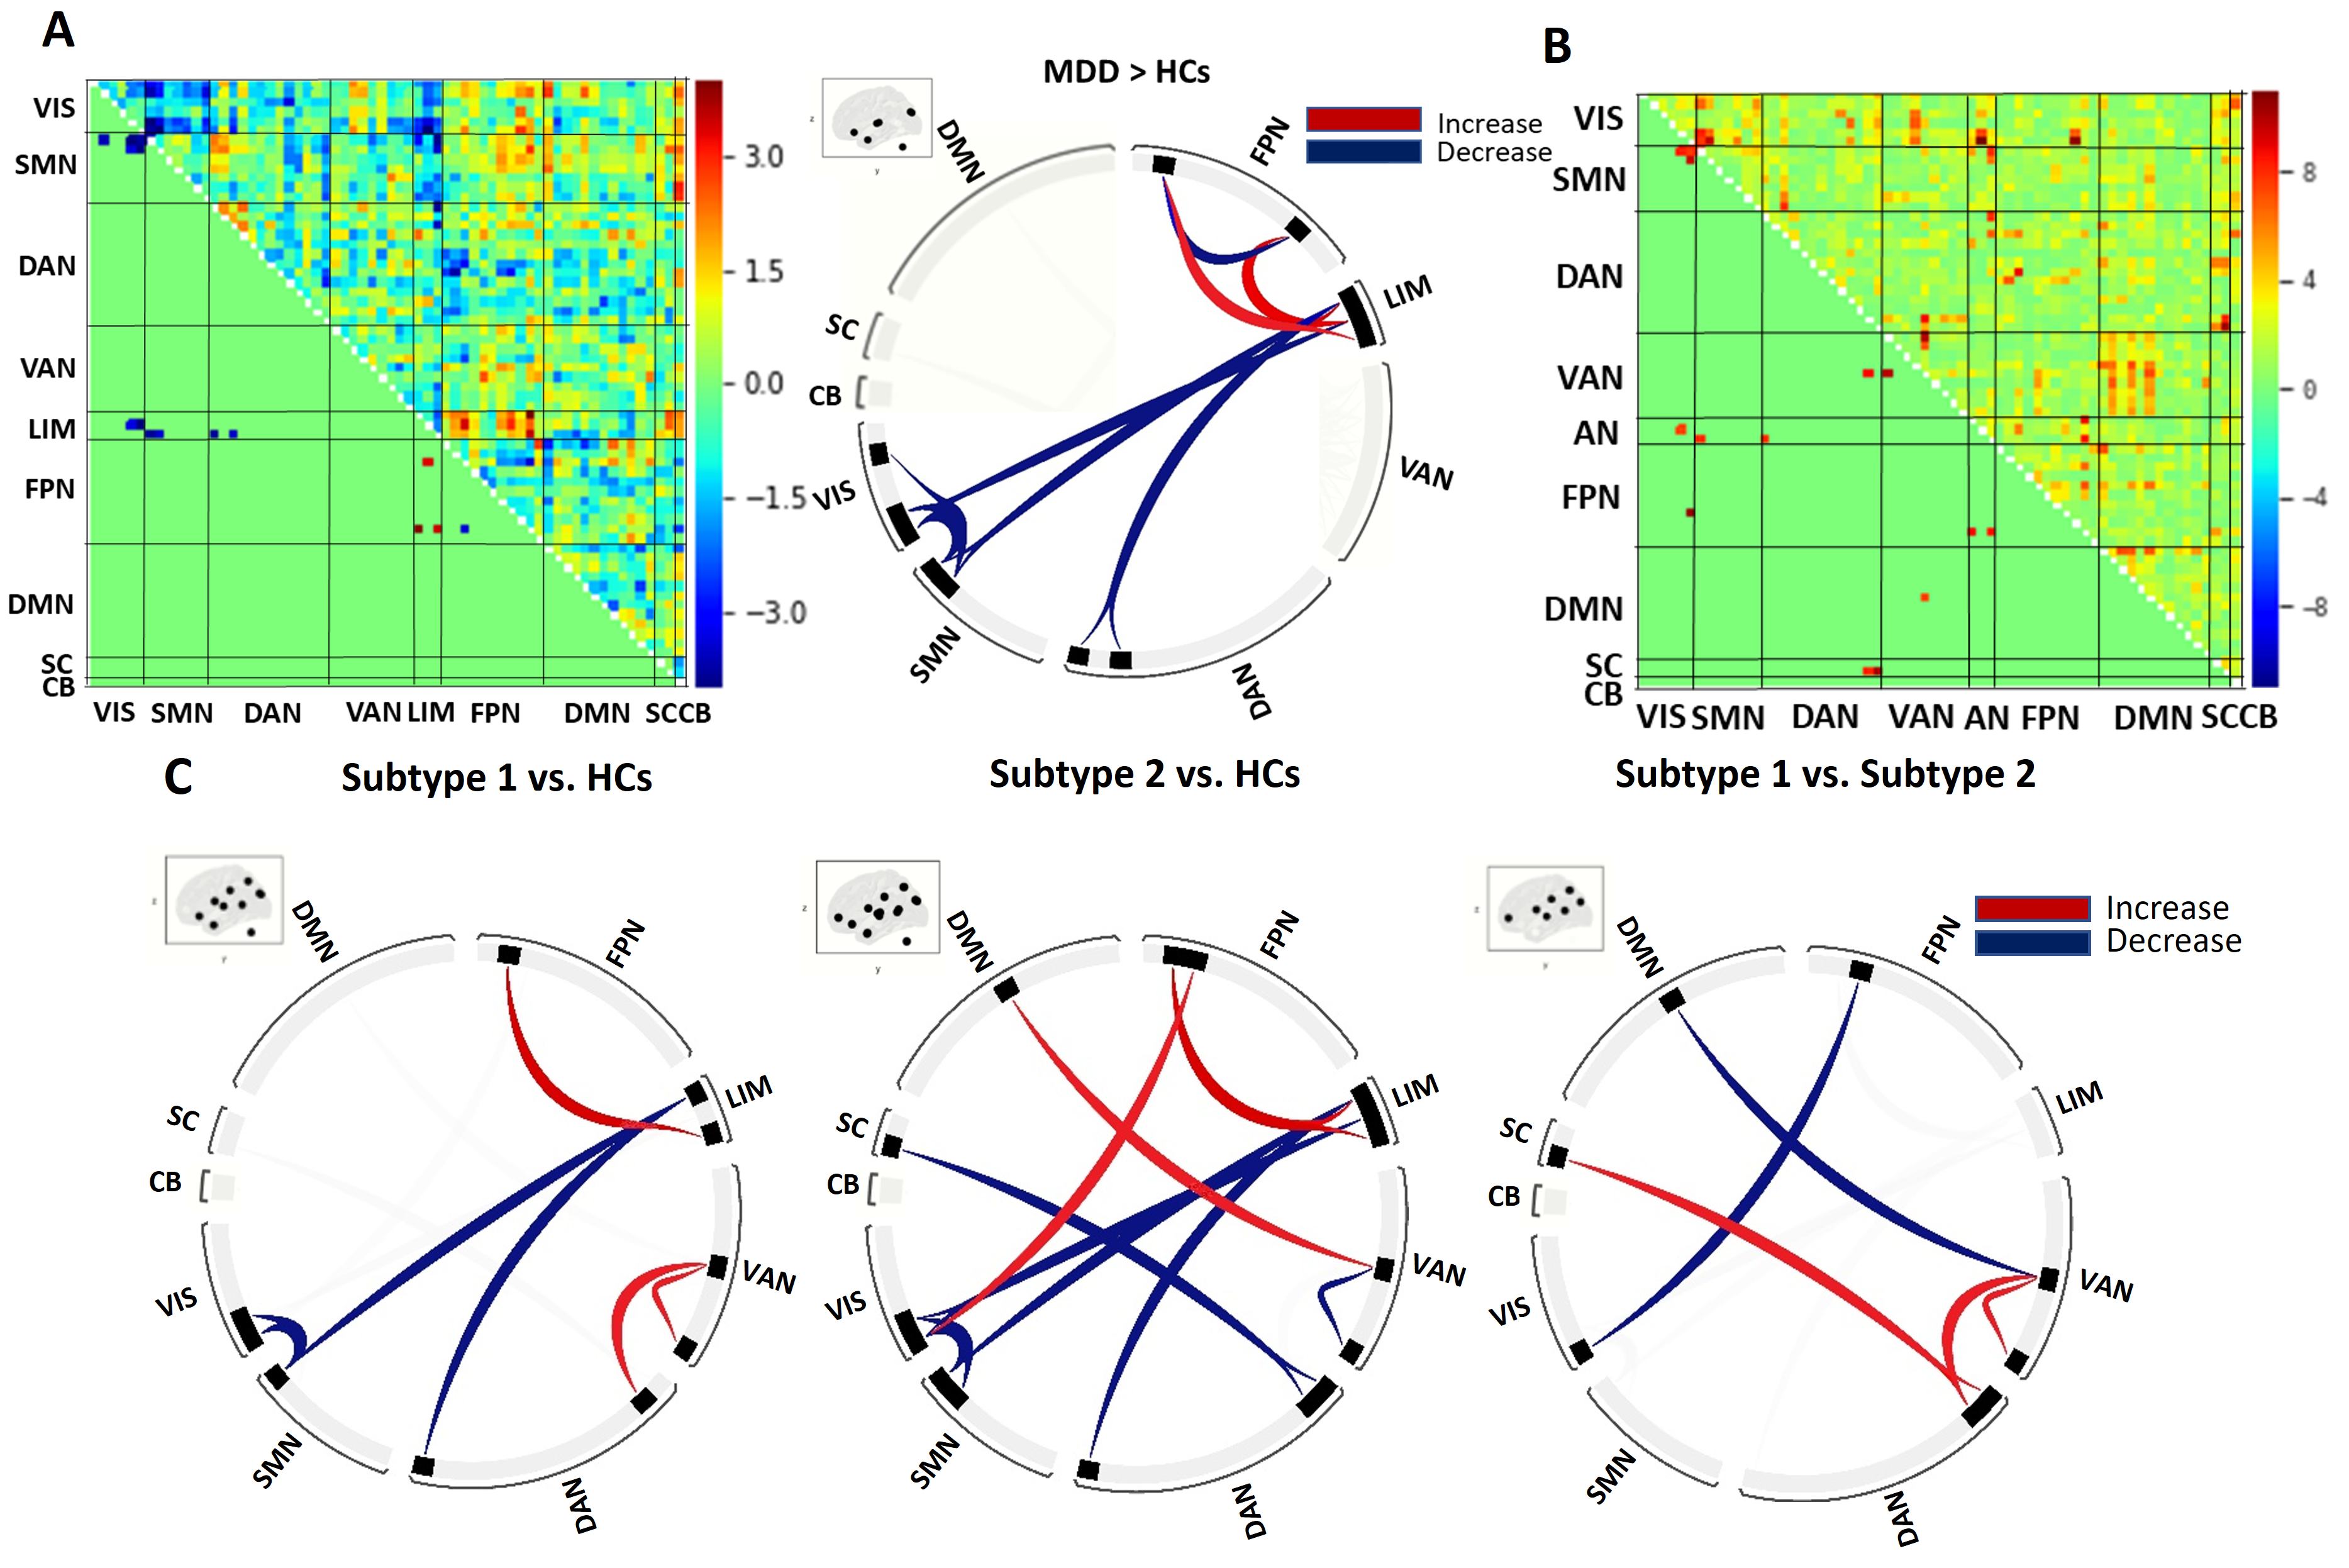
Figure 4. Statistically
significant FNC differences between MDD, MDD-subtypes
and HCs. (A) A heatmap and a circular plot showing were significantly abnormal FNC in MDD relative to HCs. (B) A heatmap showing the significant results of ANOVA in FNC among MDD-subtypes and HCs. (C) Three circular
plots showing significant FNC patterns between subtype1, subtype2
and HCs using post-hoc analyses. Statistical significance for all comparisons
were thresholded at p < 0.05, FDR corrected for cluster level and p <
0.001, uncorrected for voxel level.