Zhaoqing Li1,2, Chaoliang Sun1,2, Yi-Cheng Hsu3, Hui Liang4, Peter Basser5, and Ruiliang Bai1,2
1Interdisciplinary Institute of Neuroscience and Technology (ZIINT), School of Medicine, Zhejiang University, Hangzhou, China, HangZhou, China, 2College of Biomedical Engineering and Instrument Science, Zhejiang University, Hangzhou, China, HangZhou, China, 3MR Collaboration, Siemens Healthcare, Shanghai, China, ShangHai, China, 4Department of Neurology, First Affiliated Hospital, School of Medicine, Zhejiang University, Hangzhou, China, HangZhou, China, 5Section on Quantitative Imaging and Tissue Sciences, NICHD, National Institutes of Health, Bethesda, MD, USA, Bethesda, MD, United States
1Interdisciplinary Institute of Neuroscience and Technology (ZIINT), School of Medicine, Zhejiang University, Hangzhou, China, HangZhou, China, 2College of Biomedical Engineering and Instrument Science, Zhejiang University, Hangzhou, China, HangZhou, China, 3MR Collaboration, Siemens Healthcare, Shanghai, China, ShangHai, China, 4Department of Neurology, First Affiliated Hospital, School of Medicine, Zhejiang University, Hangzhou, China, HangZhou, China, 5Section on Quantitative Imaging and Tissue Sciences, NICHD, National Institutes of Health, Bethesda, MD, USA, Bethesda, MD, United States
We mainly found different exchange processes detected by
modulating diffusion filter (bf) and detection blocks in FEXI. It reveals the exchange between vascular and extracellular water at bf=250s/mm2,
whereas exchange related to the bi-compartmental diffusion at bf=900s/mm2 in brain.
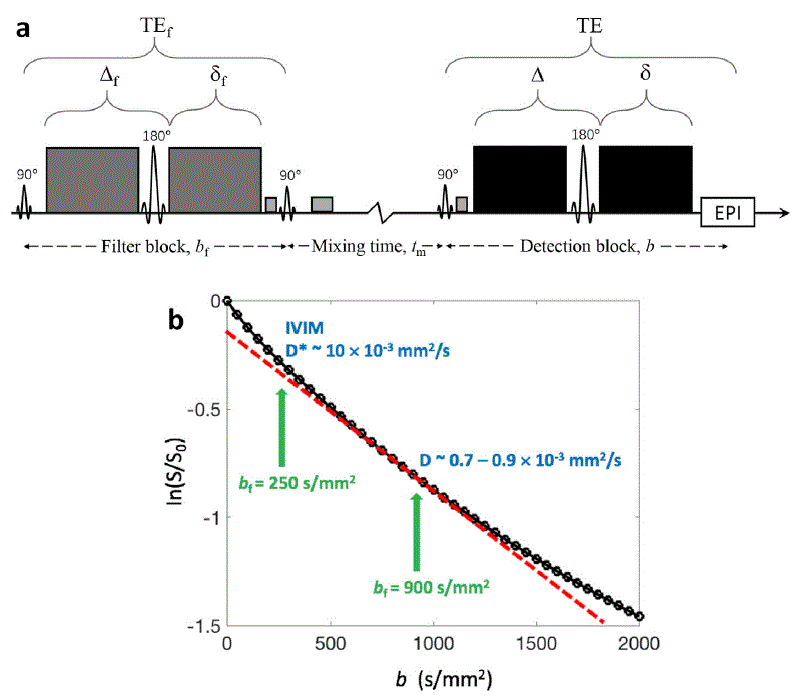
Figure 1: Illustration of the FEXI sequence (a) and the design of this study. In
figure (b), it shows the multiple
exponential diffusion-weighted signal found in brain tissue in-vivo. In this
study, two FEXI protocols were performed at two bf values. In the first protocol, FEXI was performed
with bf=250 s/mm2
and two detection b values at 0 and
250 s/mm2. In the second protocol, FEXI was performed with bf=900 s/mm2 and
two detection b values at 40 and 900 s/mm2.
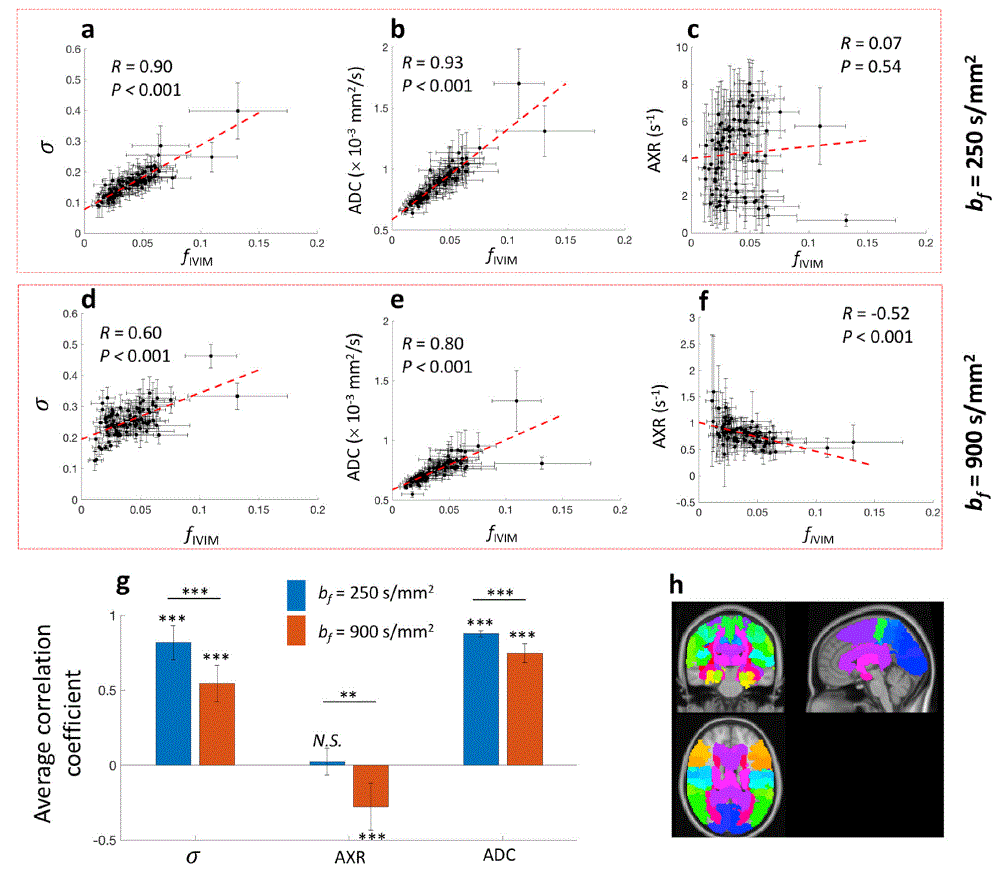
Figure 3: Correlation analysis between vascular density metrics fIVIM
and metrics of FEXI in the standard space. As shown in (h), brain was divided into 121 regions based on Jülich
histological atlas. In (a–f), the
black dots and error bars reflect the mean and standard deviation of MRI metrics
of all subjects in each region. (g)
Average correlation across regions and subjects between FEXI metrics and fIVIM. Students’ t-test and paired Students’ t-test was performed on Fisher
Z-transformed correlation coefficients with * representing P<0.05, ** P <
0.01, *** P < 0.005, and N.S. P
> 0.05.