Tomasz Pieciak1,2, Maryam Afzali3, Fabian Bogusz1, Dominika Ciupek1, Derek K. Jones3, and Marco Pizzolato4,5
1AGH University of Science and Technology, Kraków, Poland, 2LPI, ETSI Telecomunicación, Universidad de Valladolid, Valladolid, Spain, Valladolid, Spain, 3Cardiff University Brain Research Imaging Centre (CUBRIC), School of Psychology, Cardiff University, Cardiff, United Kingdom, 4Department of Applied Mathematics and Computer Science, Technical University of Denmark, Kongens Lyngby, Denmark, 5Signal Processing Lab (LTS5), École polytechnique fédérale de Lausanne (EPFL), Lausanne, Switzerland
1AGH University of Science and Technology, Kraków, Poland, 2LPI, ETSI Telecomunicación, Universidad de Valladolid, Valladolid, Spain, Valladolid, Spain, 3Cardiff University Brain Research Imaging Centre (CUBRIC), School of Psychology, Cardiff University, Cardiff, United Kingdom, 4Department of Applied Mathematics and Computer Science, Technical University of Denmark, Kongens Lyngby, Denmark, 5Signal Processing Lab (LTS5), École polytechnique fédérale de Lausanne (EPFL), Lausanne, Switzerland
The results show that as we increase the inversion time the contrast between the gray and white matter in DTI and MAP-MRI indices increases. By increasing the b-value, more and more restricted compartments are selected, hence only those compartments will contribute to the calculated T1.
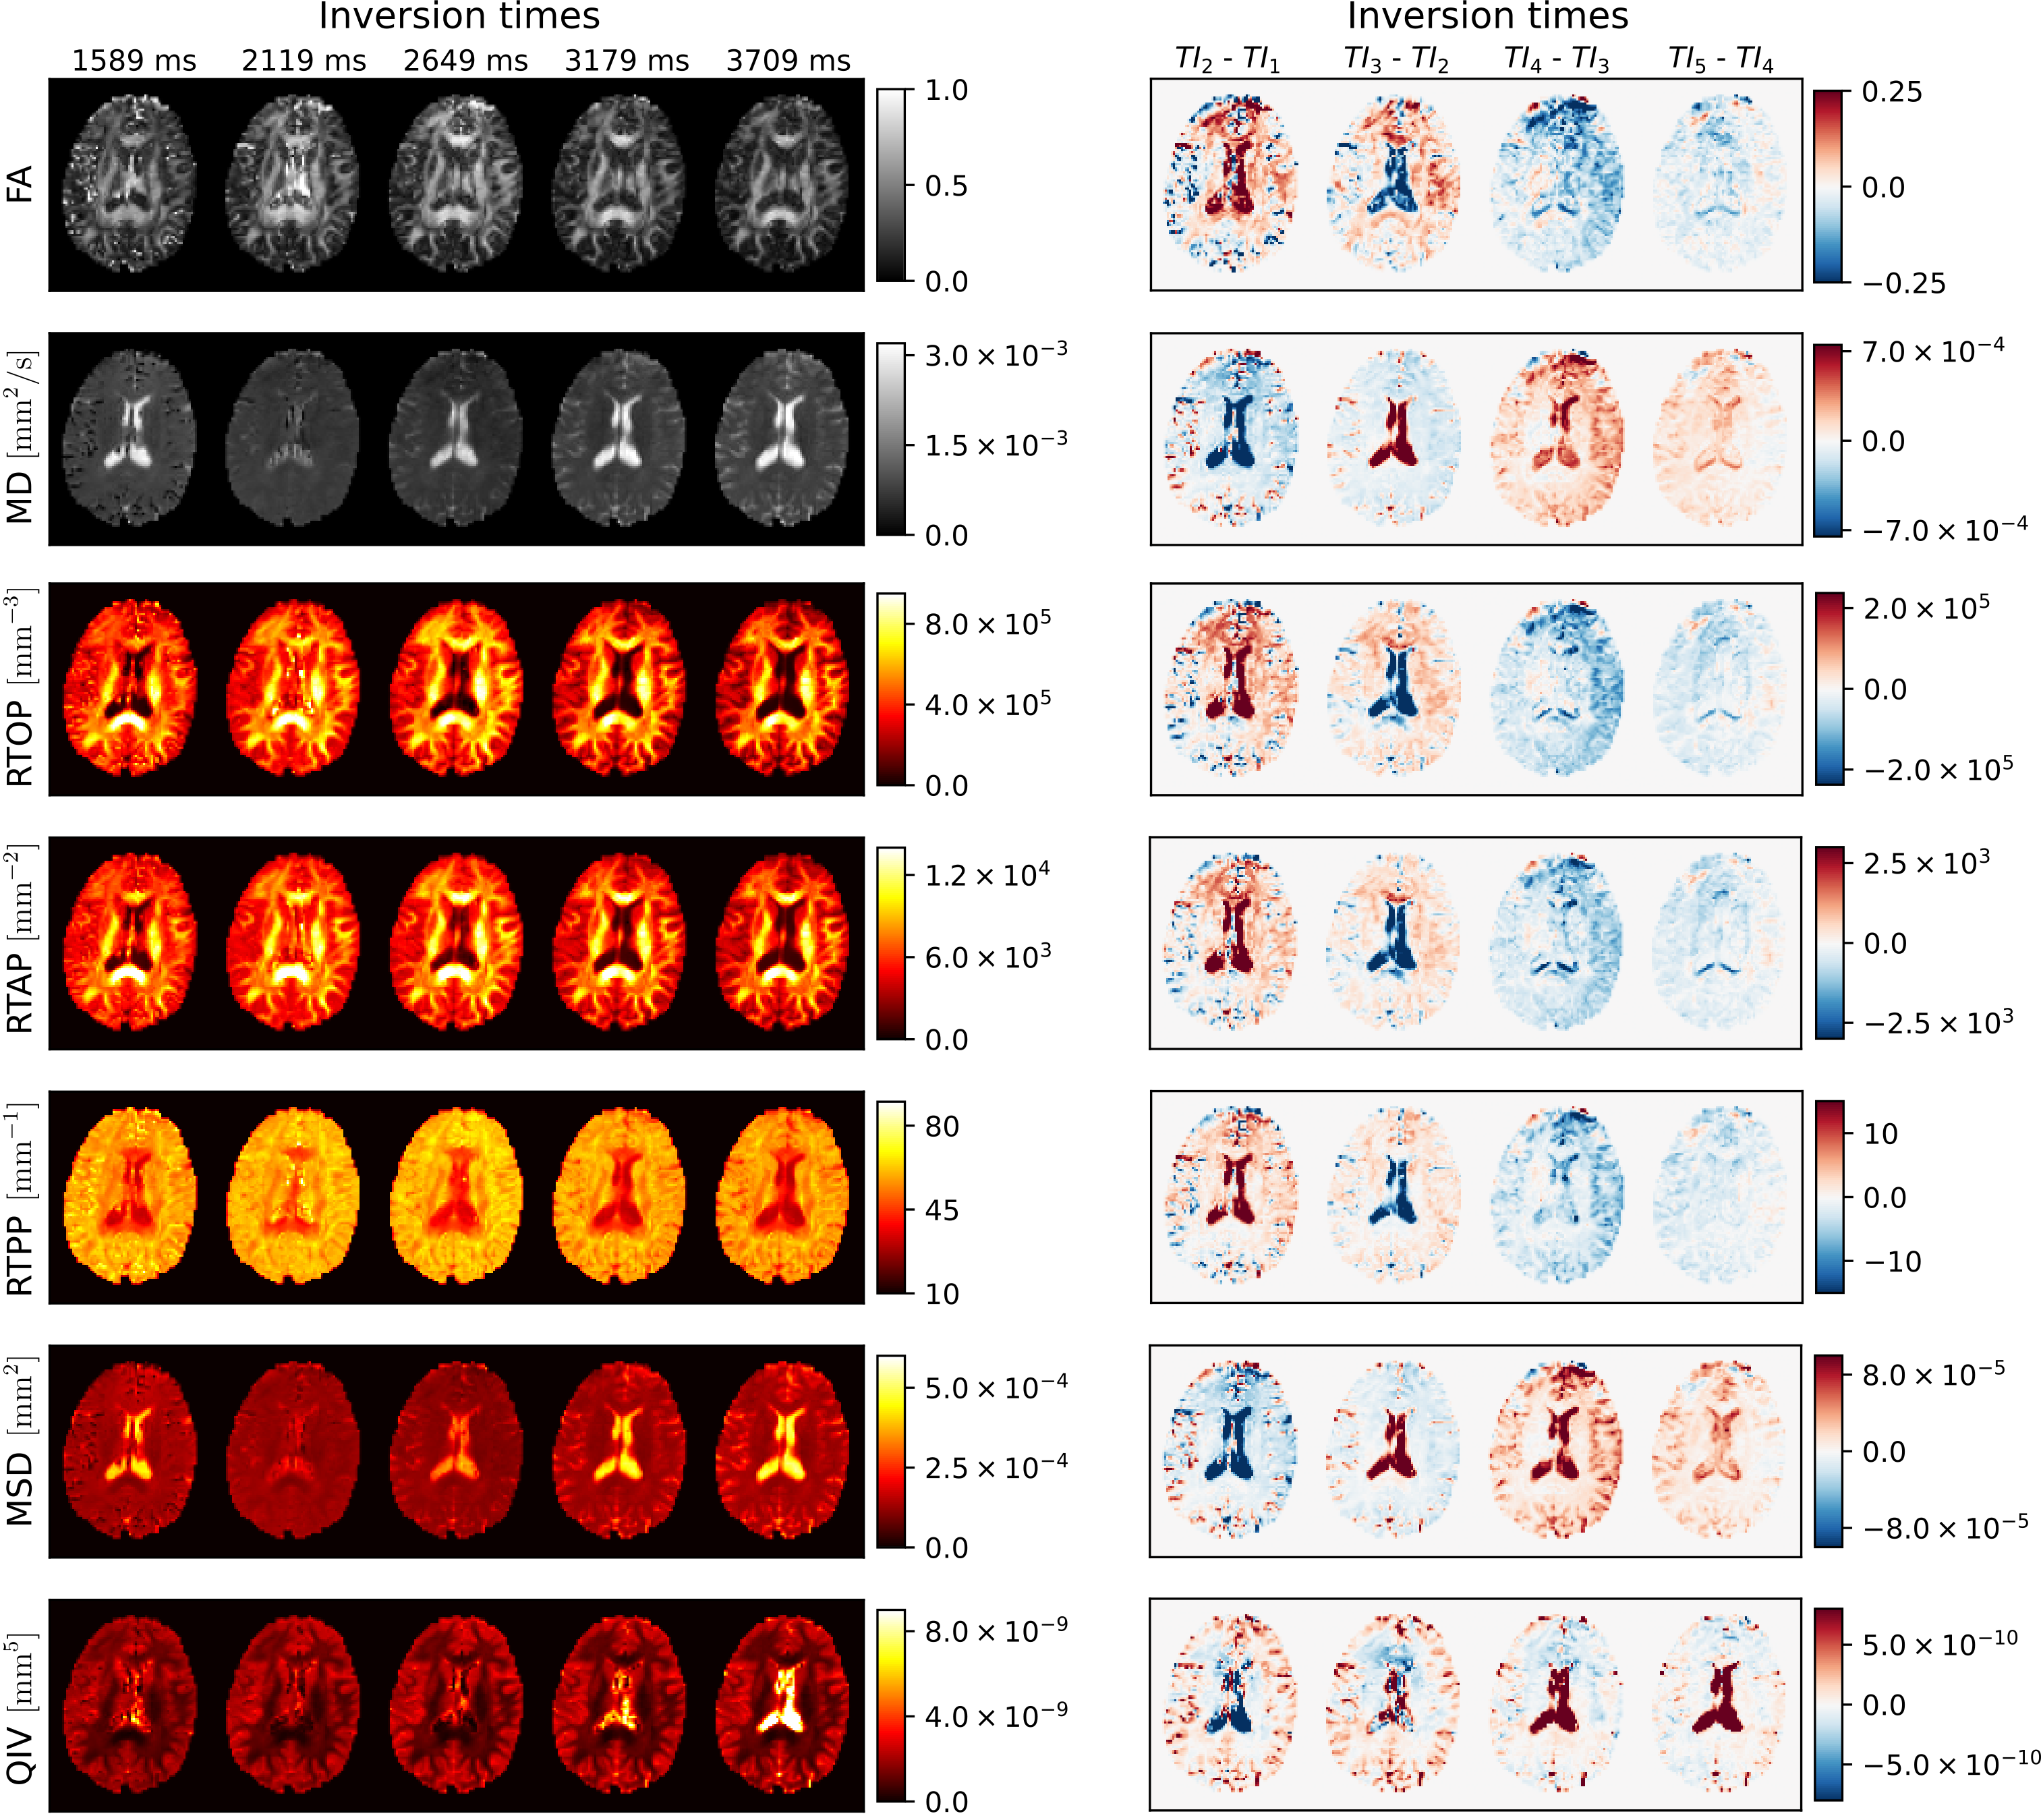
Visual inspection of DTI and MAP-MRI metrics under different inversion times (left) and pairwise differences between the representations at $$$k+1$$$ and $$$k$$$-th inversion times (right). For example, in the first column we observe the difference between the maps obtained at $$$TI_2=2119 \ \mathrm{ms}$$$ and $$$TI_1=1598 \ \mathrm{ms}$$$, in the second column the difference between $$$TI_3=2649 \ \mathrm{ms}$$$ and $$$TI_2=2119 \ \mathrm{ms}$$$, and so on.
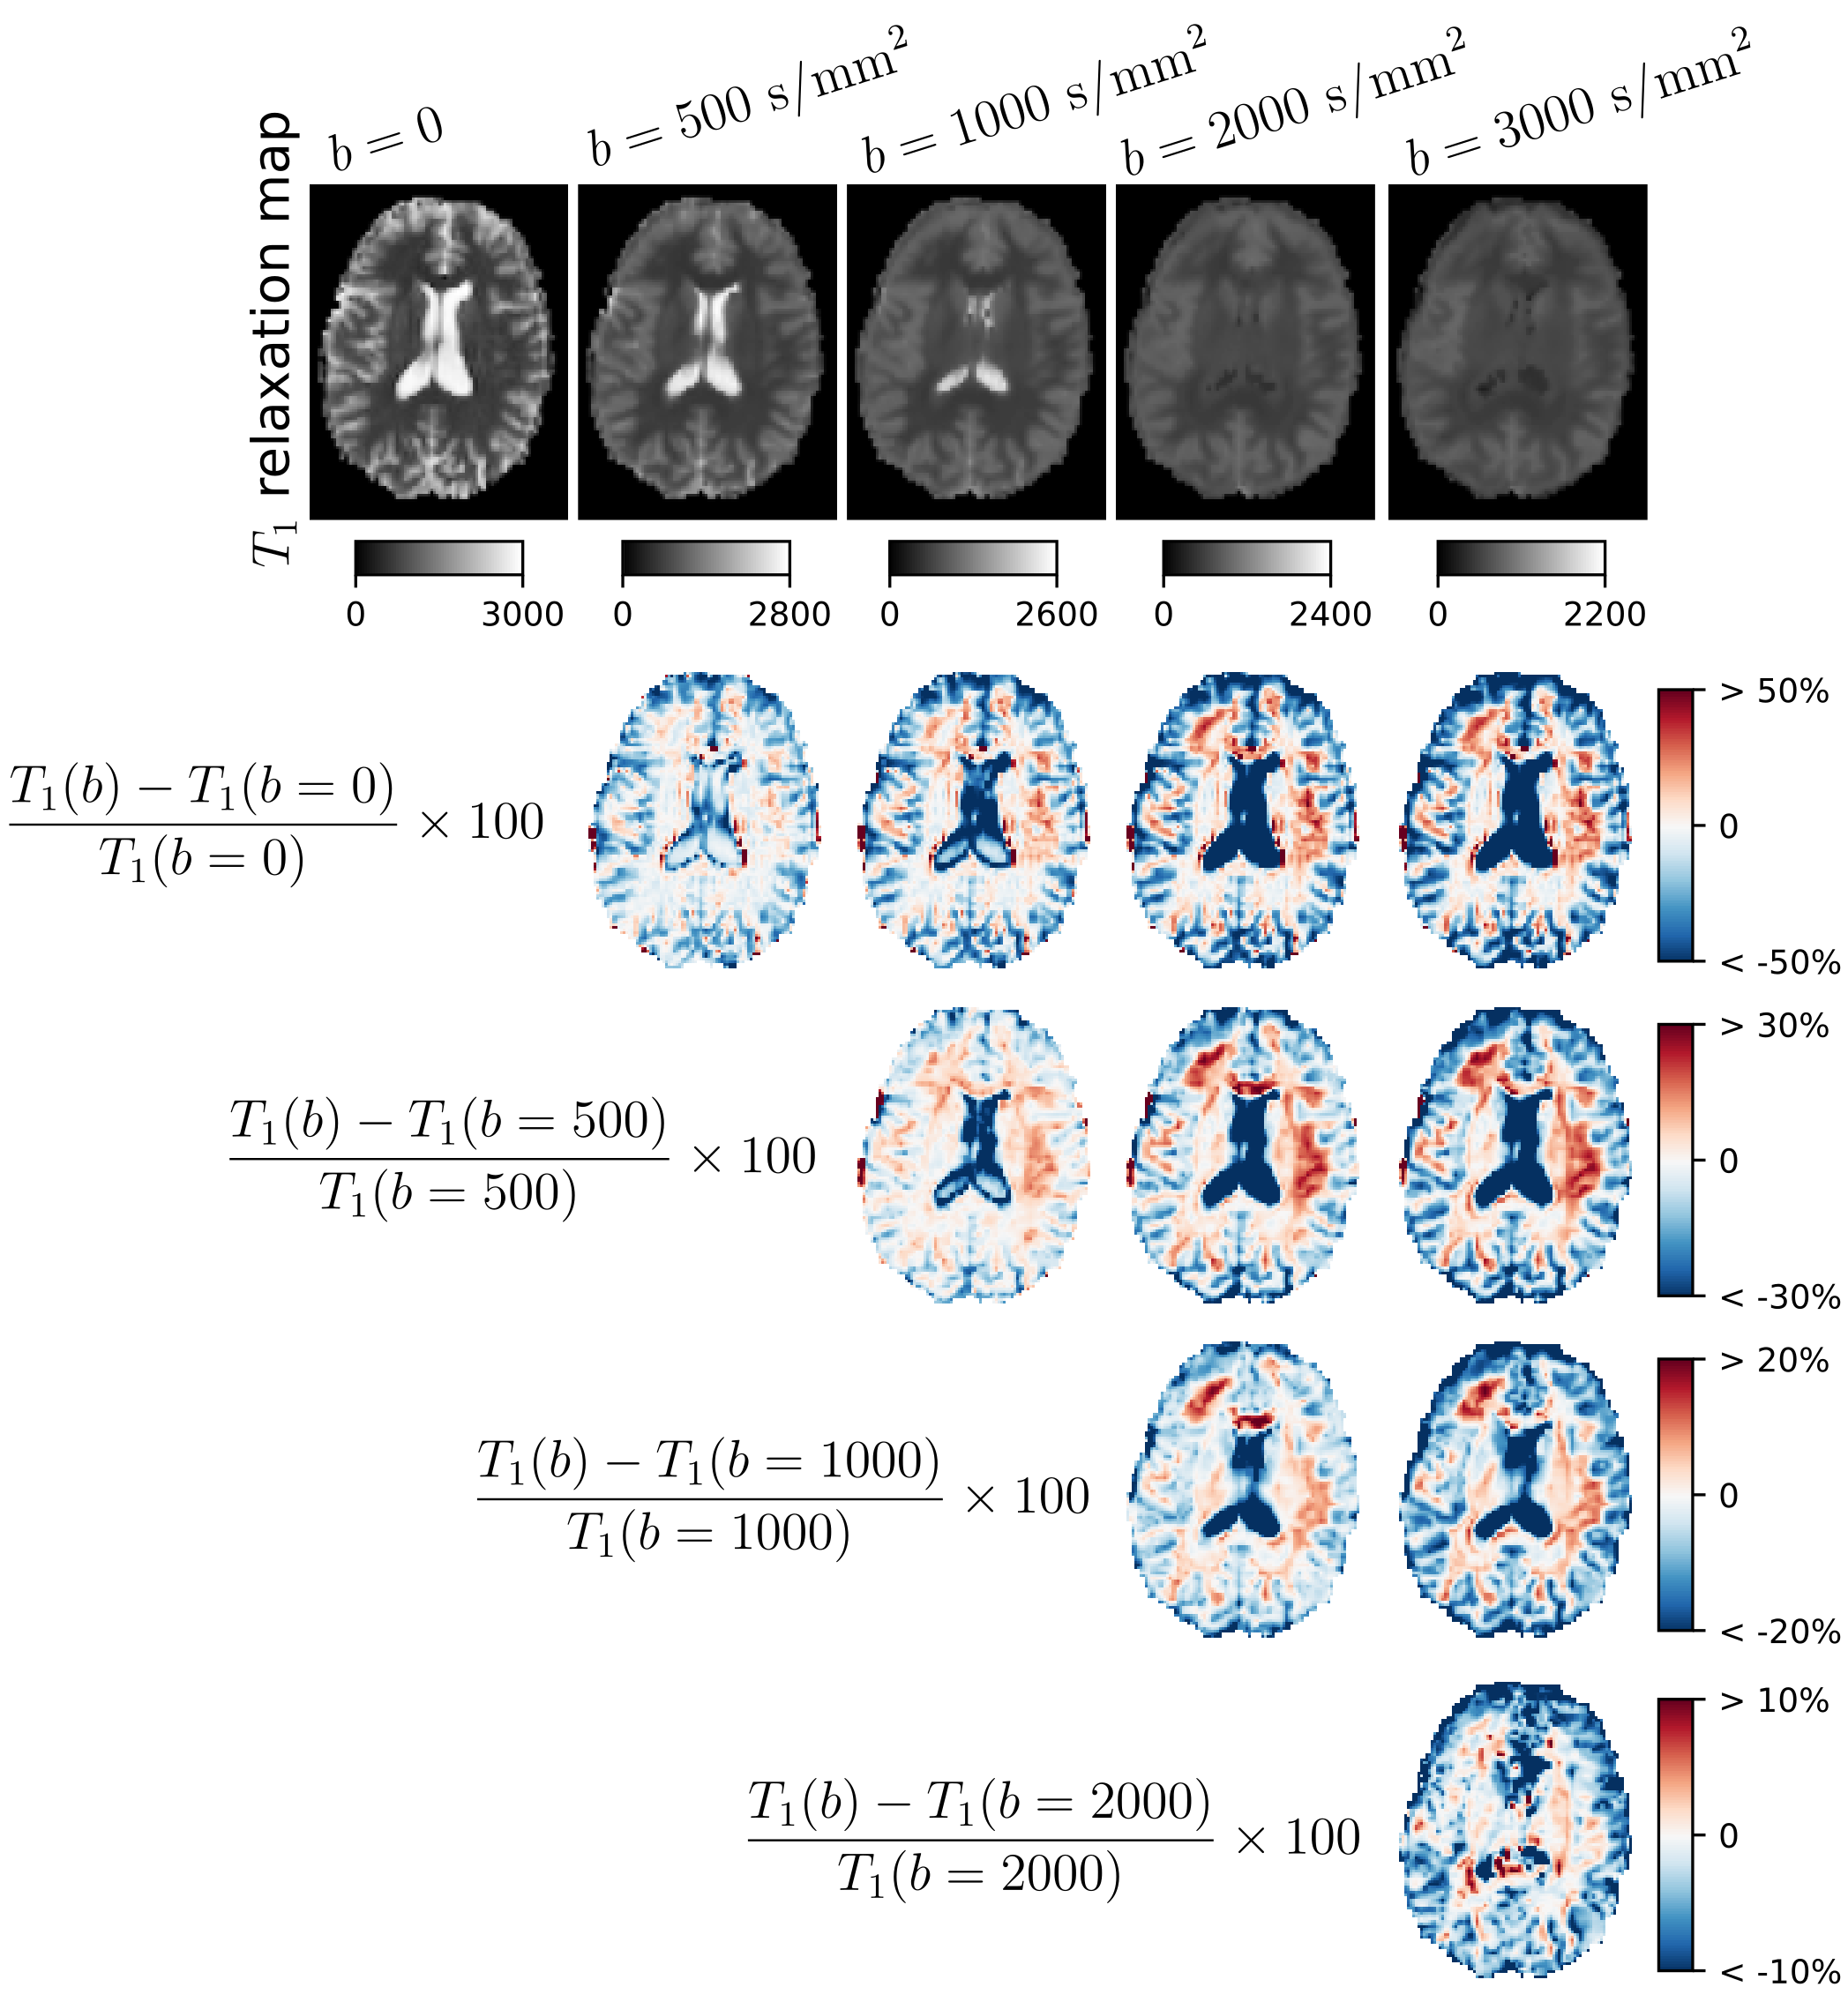
The longitudinal $$$T_1$$$ relaxation maps (in milliseconds) estimated under different $$$b$$$-values (top) and relative differences (in %) between $$$T_1$$$ relaxation maps obtained at two $$$b$$$-values (bottom). Each formula presents the way of calculating the differences presented in the row. For example, the first row presents the relative differences between $$$T_1$$$ relaxation map at $$$b=500 \ \mathrm{s}/\mathrm{mm}^2$$$ and $$$b=0$$$, $$$b=1000 \ \mathrm{s}/\mathrm{mm}^2$$$ and $$$b=0$$$, and so on.