Simona Schiavi1, Sila Genc2, Maxime Chamberland2, Chantal M.W. Tax2,3, Erika P. Raven4, Alessandro Daducci1, and Derek K Jones2,5
1Department of Computer Science, University of Verona, Verona, Italy, 2CUBRIC, School of Psychology, Cardiff University, Cardiff, United Kingdom, 3Image Sciences Institute, University Medical Center Utrecht, Utrecht, Netherlands, 4Department of Radiology, Bernard and Irene Schwartz Center for Biomedical Imaging, New York University School of Medicine, New York, NY, United States, 5Mary MacKillop Institute for Health Research, Australian Catholic University, Melbourne, Australia
1Department of Computer Science, University of Verona, Verona, Italy, 2CUBRIC, School of Psychology, Cardiff University, Cardiff, United Kingdom, 3Image Sciences Institute, University Medical Center Utrecht, Utrecht, Netherlands, 4Department of Radiology, Bernard and Irene Schwartz Center for Biomedical Imaging, New York University School of Medicine, New York, NY, United States, 5Mary MacKillop Institute for Health Research, Australian Catholic University, Melbourne, Australia
Microstructure-informed network analyses of 88 children/adolescents (8-18 yrs) uncovered distinct sub-network maturational patterns, with the strongest age effect on global efficiency, clustering coefficient and mean strength in the visual network.
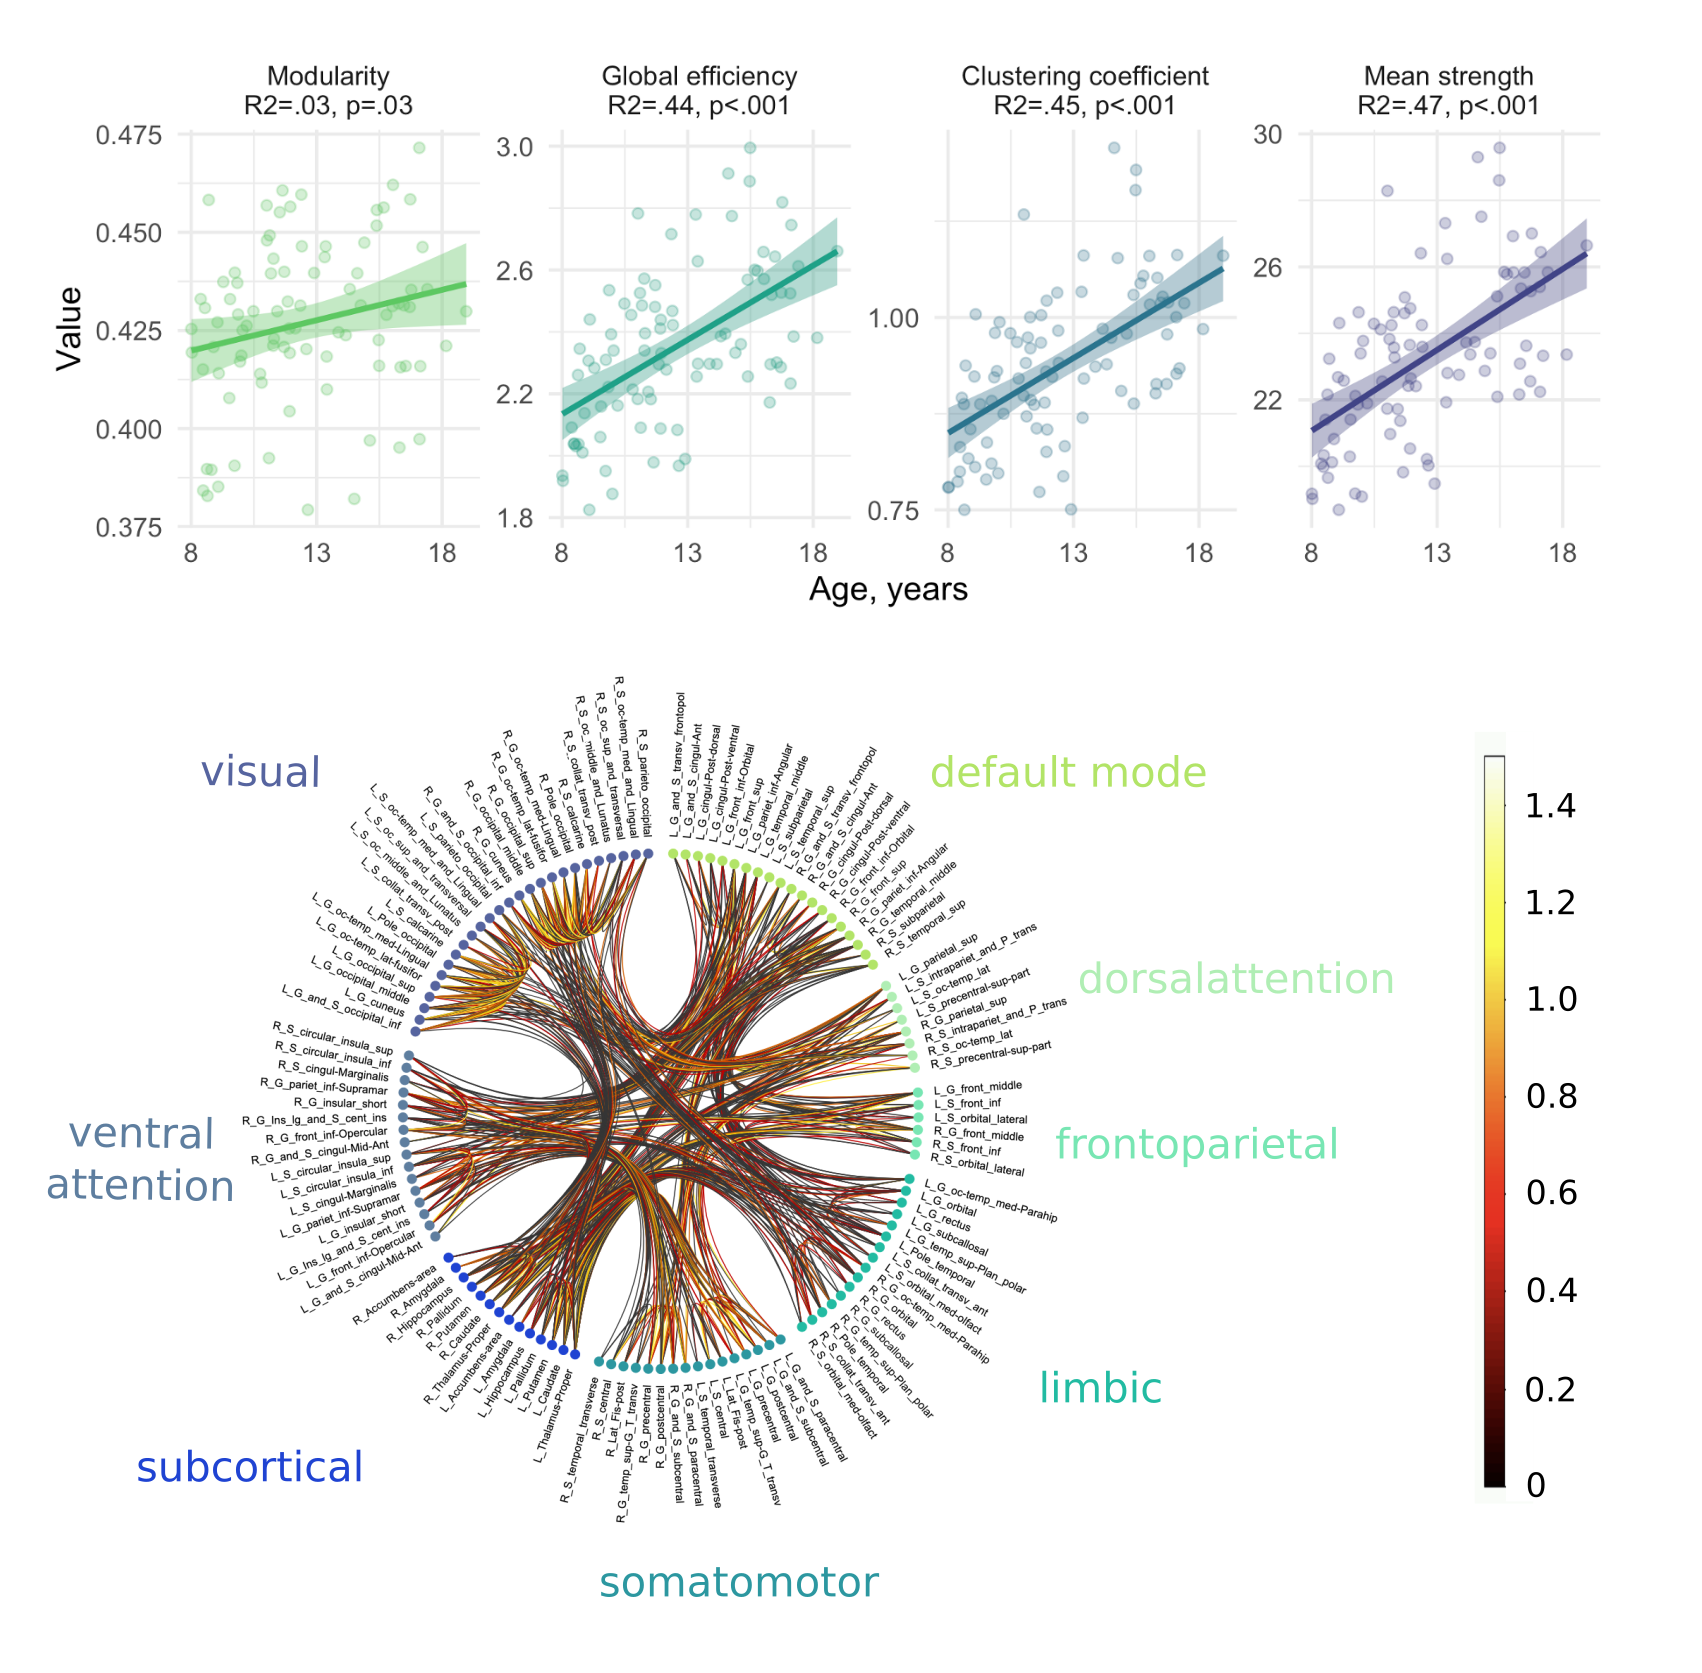
Figure 2: Relationship between age and global network metrics computed for the whole connectome realized with Destrieux parcellation. Circle plots indicate the strength of connections obtained using the intra-axonal signal fraction estimated with COMMIT. R2 and corresponding p-values are reported on top of each plot.
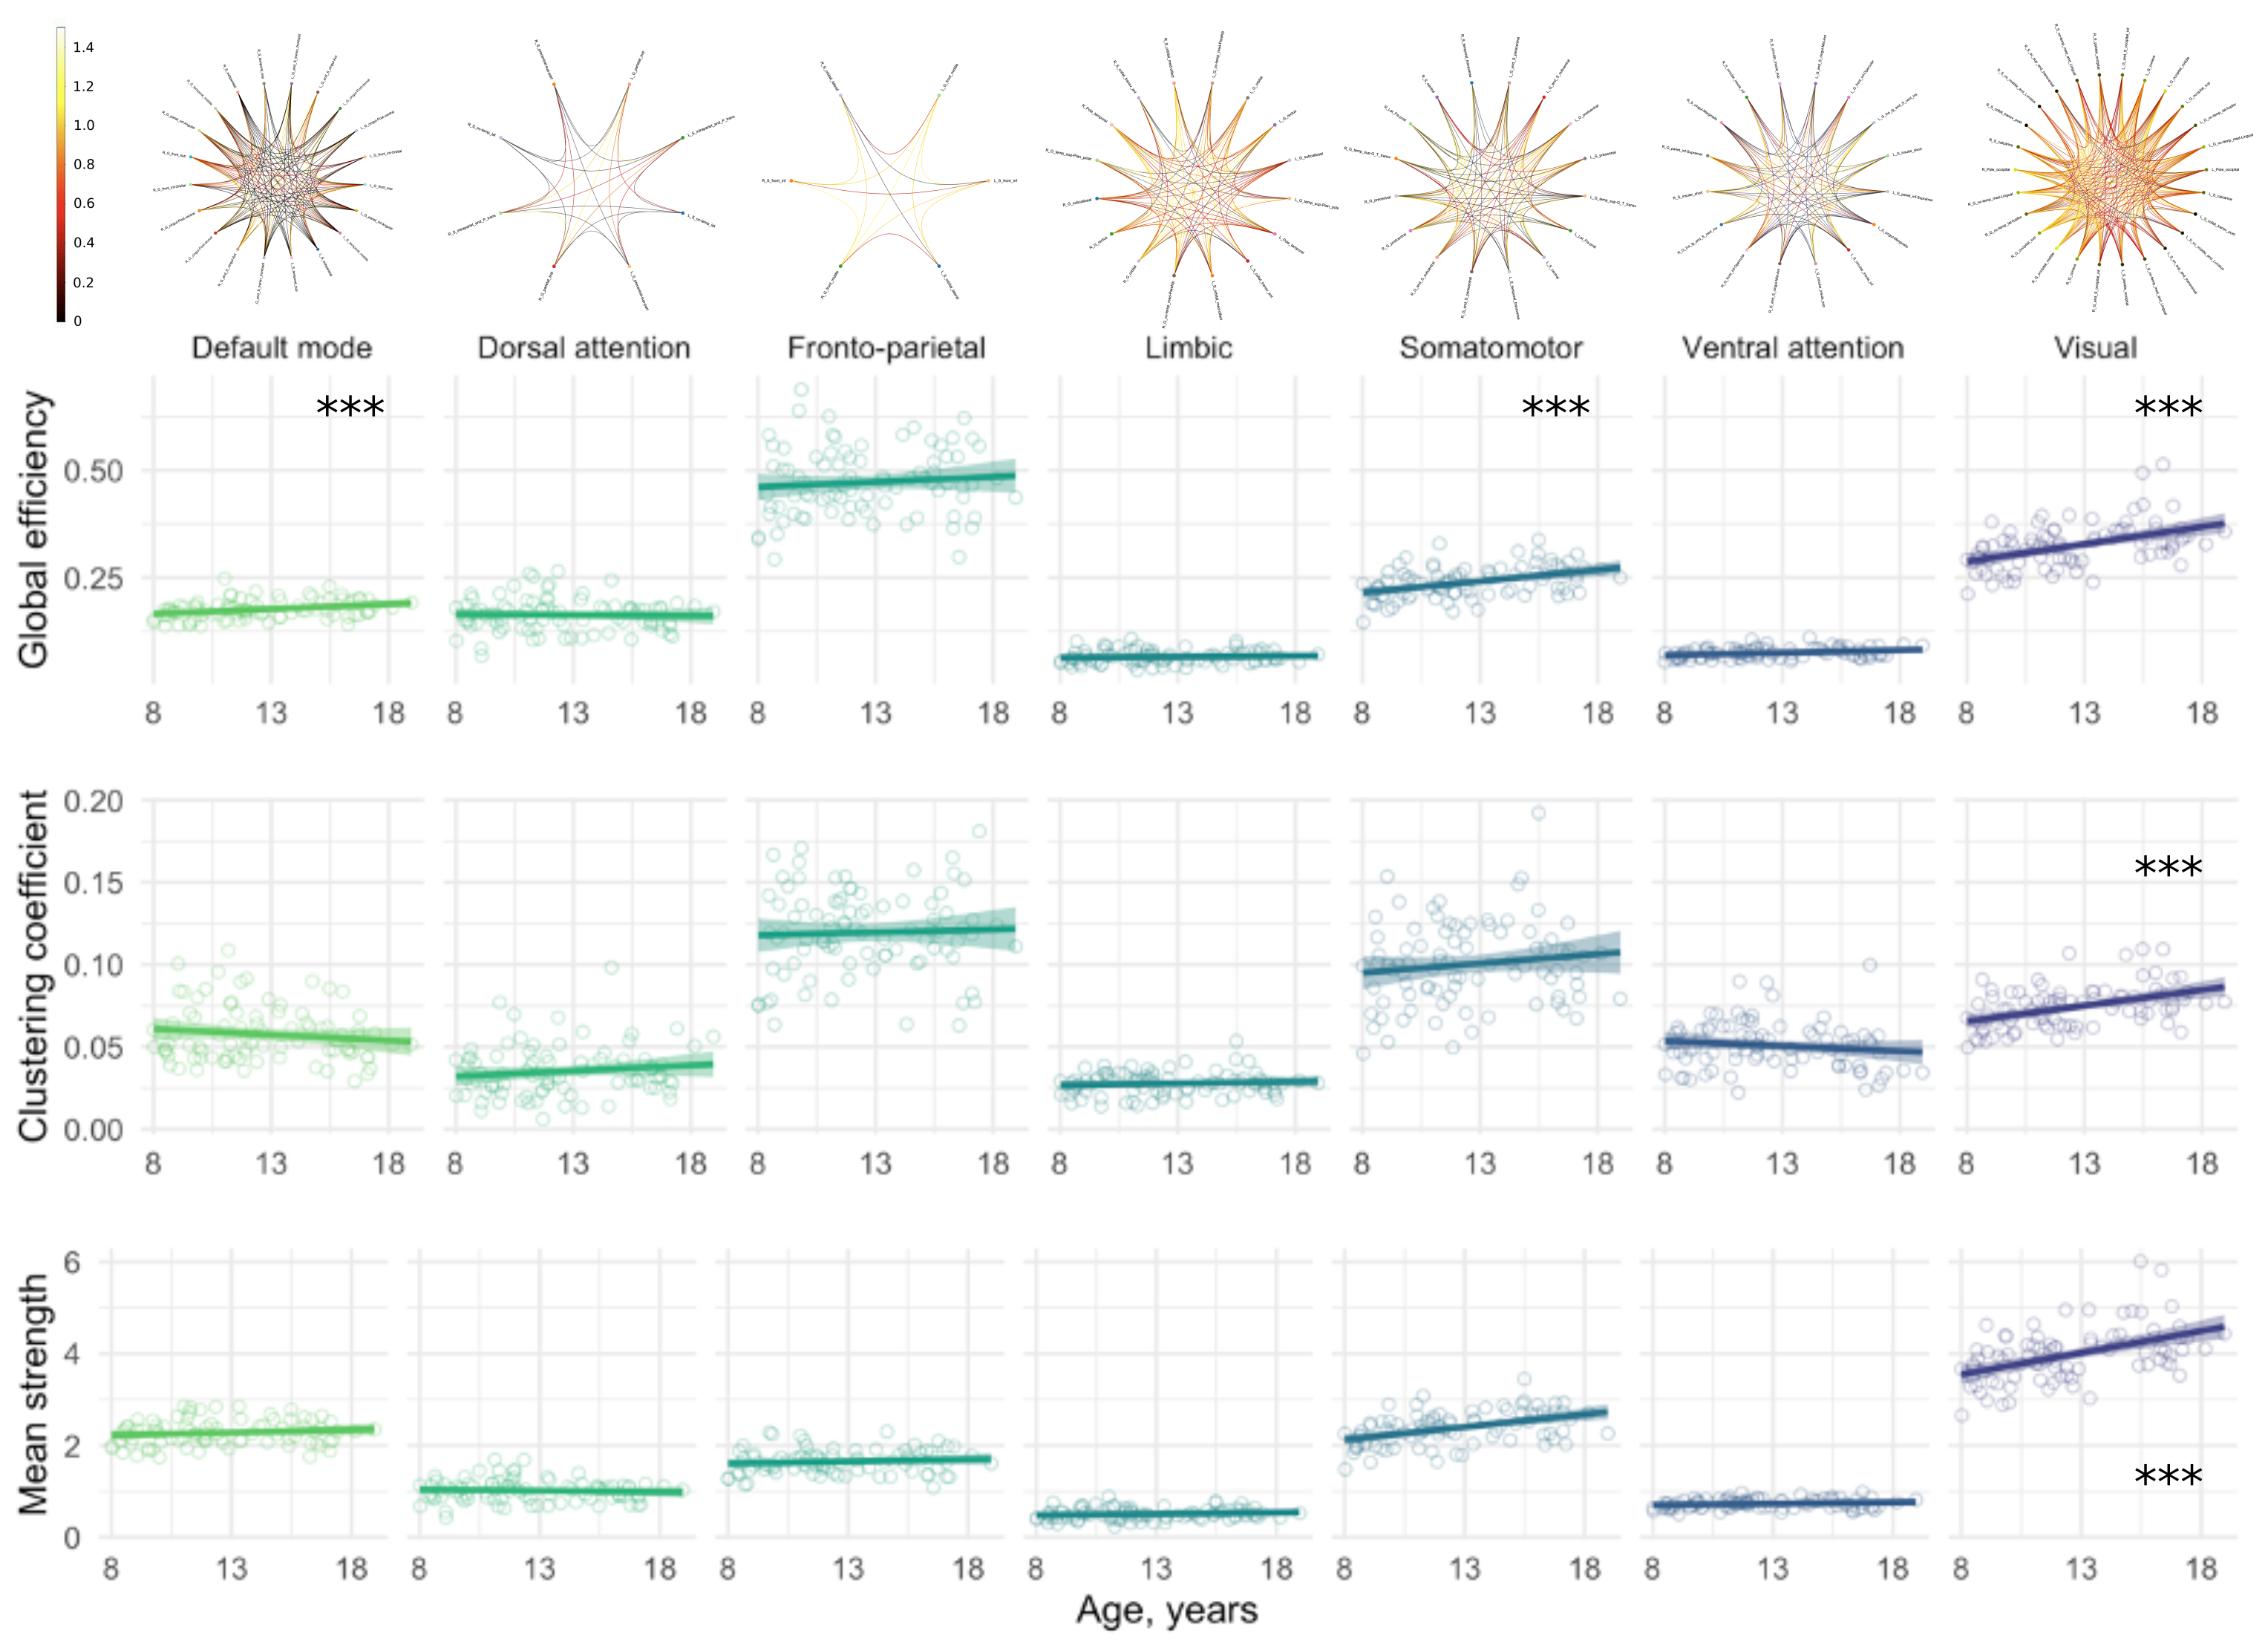
Figure 3: Developmental network characteristics. Relationship between age and global sub-networks characteristics. Circle plots indicate strength of sub-network connections obtained using the intra-axonal signal fraction estimated with COMMIT. *** indicates a significant relationship with age (p<.001 after multiple comparisons adjustment).