Julia J Gevaert1,2, Corby Fink3,4, Jimmy D Dikeakos3, Gregory A Dekaban3,4, and Paula J Foster1,2
1Department of Medical Biophysics, University of Western Ontario, London, ON, Canada, 2Cellular and Molecular Imaging Group, Robarts Research Institute, London, ON, Canada, 3Department of Microbiology and Immunology, University of Western Ontario, London, ON, Canada, 4Biotherapeutics Research Laboratory, Robarts Research Institute, London, ON, Canada
1Department of Medical Biophysics, University of Western Ontario, London, ON, Canada, 2Cellular and Molecular Imaging Group, Robarts Research Institute, London, ON, Canada, 3Department of Microbiology and Immunology, University of Western Ontario, London, ON, Canada, 4Biotherapeutics Research Laboratory, Robarts Research Institute, London, ON, Canada
DCs labeled with Synomag-D and TAs demonstrated a cellular sensitivity of 6k cells with 1min 2D images. Vivotrax labeled DCs revealed extracellular iron and clumping of iron, which was pronounced with TAs. Signal from 250k and 25k cells could be resolved at a distance of 2cm with 3D imaging.
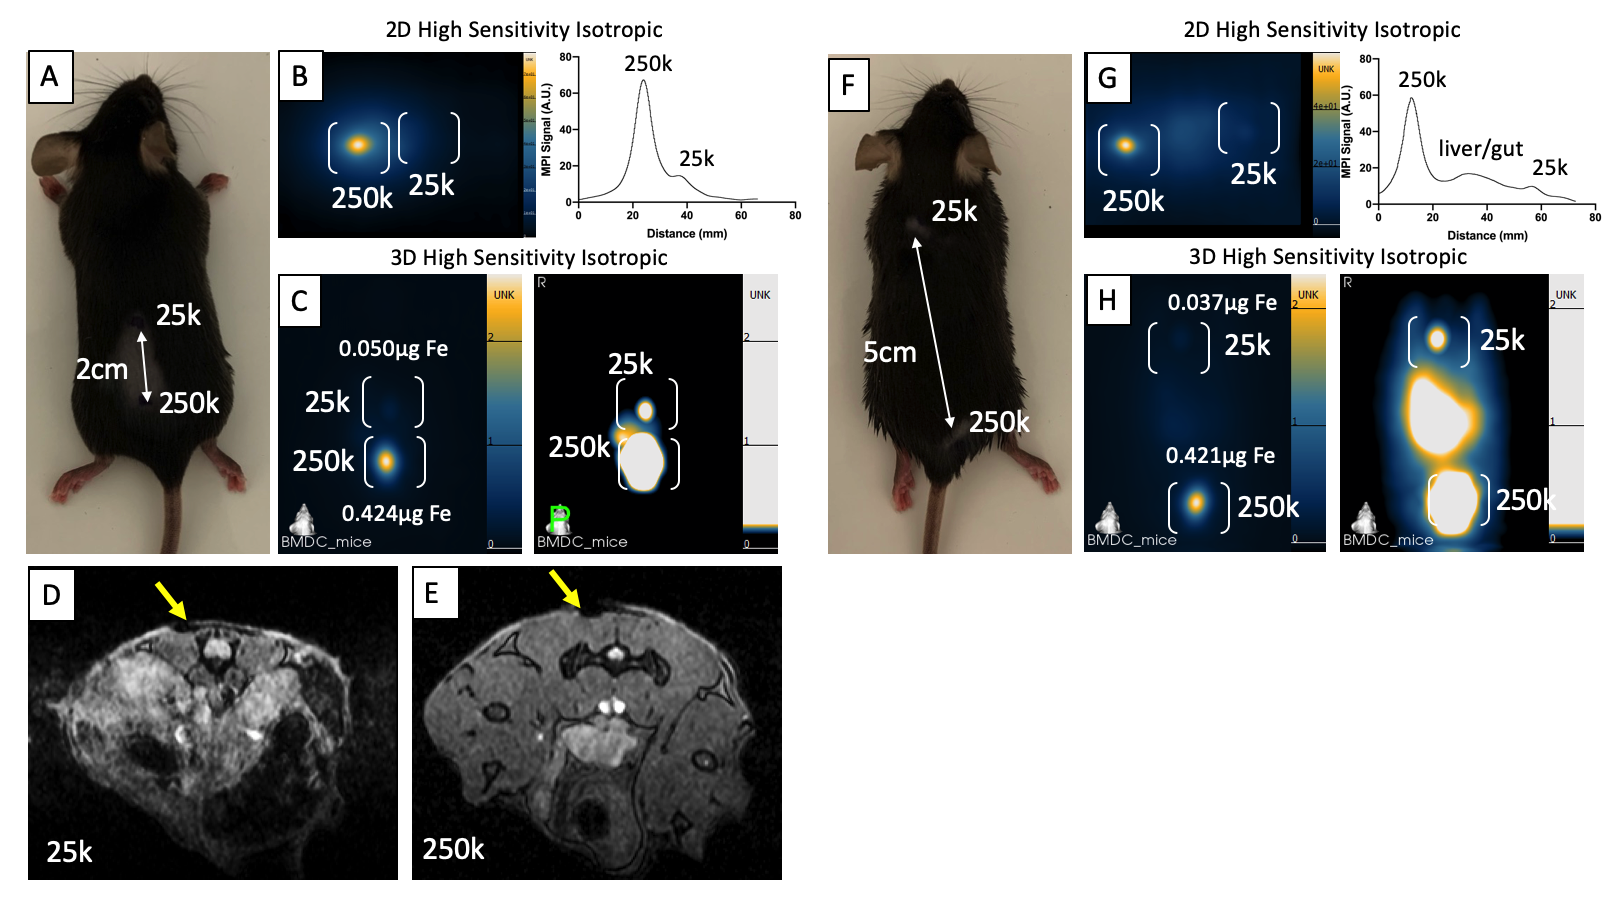
Figure 4: In-vivo cellular sensitivity and resolution of DCs. 25k and 250k cells injected subcutaneously 2cm (A) and 5cm apart (F). Signal from 25k cells is hidden within the signal from 250k cells, with indistinct peaks from the corresponding signal intensity profile (B). Signals are resolved using 3D imaging (35 projections) after window leveling to the lower signal (C). MRI confirms signal voids from 25k (D) and 250k cells (E). Signal from 250k, liver/gut, and 25k is seen with 2D (G) and 3D (H) images.
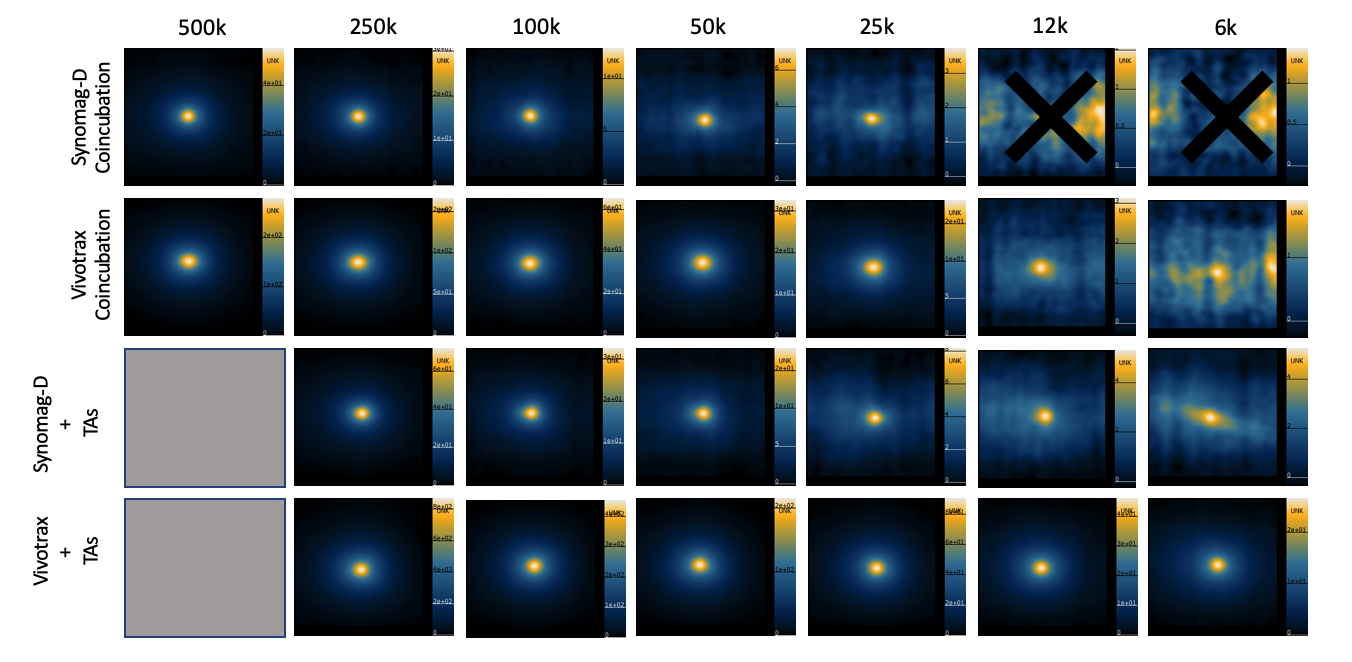
Figure 2: Cellular detection limits of DCs labeled with Vivotrax and Synomag-D with and without TAs. Images are of a single sample scanned at a time. No TAs limits detection of Synomag-D to 25k cells. 12k and 6k cell samples were not detectable (black X). With TAs, 6000 cells are visible for both Vivotrax and Synomag-D. 500k samples using TAs for labelling were not prepared (gray squares). Extracellular iron contributes to overestimation of signal with Vivotrax. More signal is detected using Vivotrax with TAs than with without TAs.