Mohammad S. E. Sendi1, Robyn L Miller2, Elizabeth Mormino3, David H Salat4, and Vince D Calhoun5
1Georgia Institute of Technology/Emory University, ATLANTA, GA, United States, 2Georgia State University, Atlanta, GA, United States, 3Stanford University, Stanford,, GA, United States, 4Harvard University, Cambridge, MA, United States, 5Georgia Institute of Technology, Atlanta, GA, United States
1Georgia Institute of Technology/Emory University, ATLANTA, GA, United States, 2Georgia State University, Atlanta, GA, United States, 3Stanford University, Stanford,, GA, United States, 4Harvard University, Cambridge, MA, United States, 5Georgia Institute of Technology, Atlanta, GA, United States
Brain
instability of Alzheimer's disease (AD) patients was explored in this study.
This finding introduces brain instability as a biomarker of AD progression and
suggests multiple sessions scanning in analyzing resting state-fMRI data in
this group of patients.
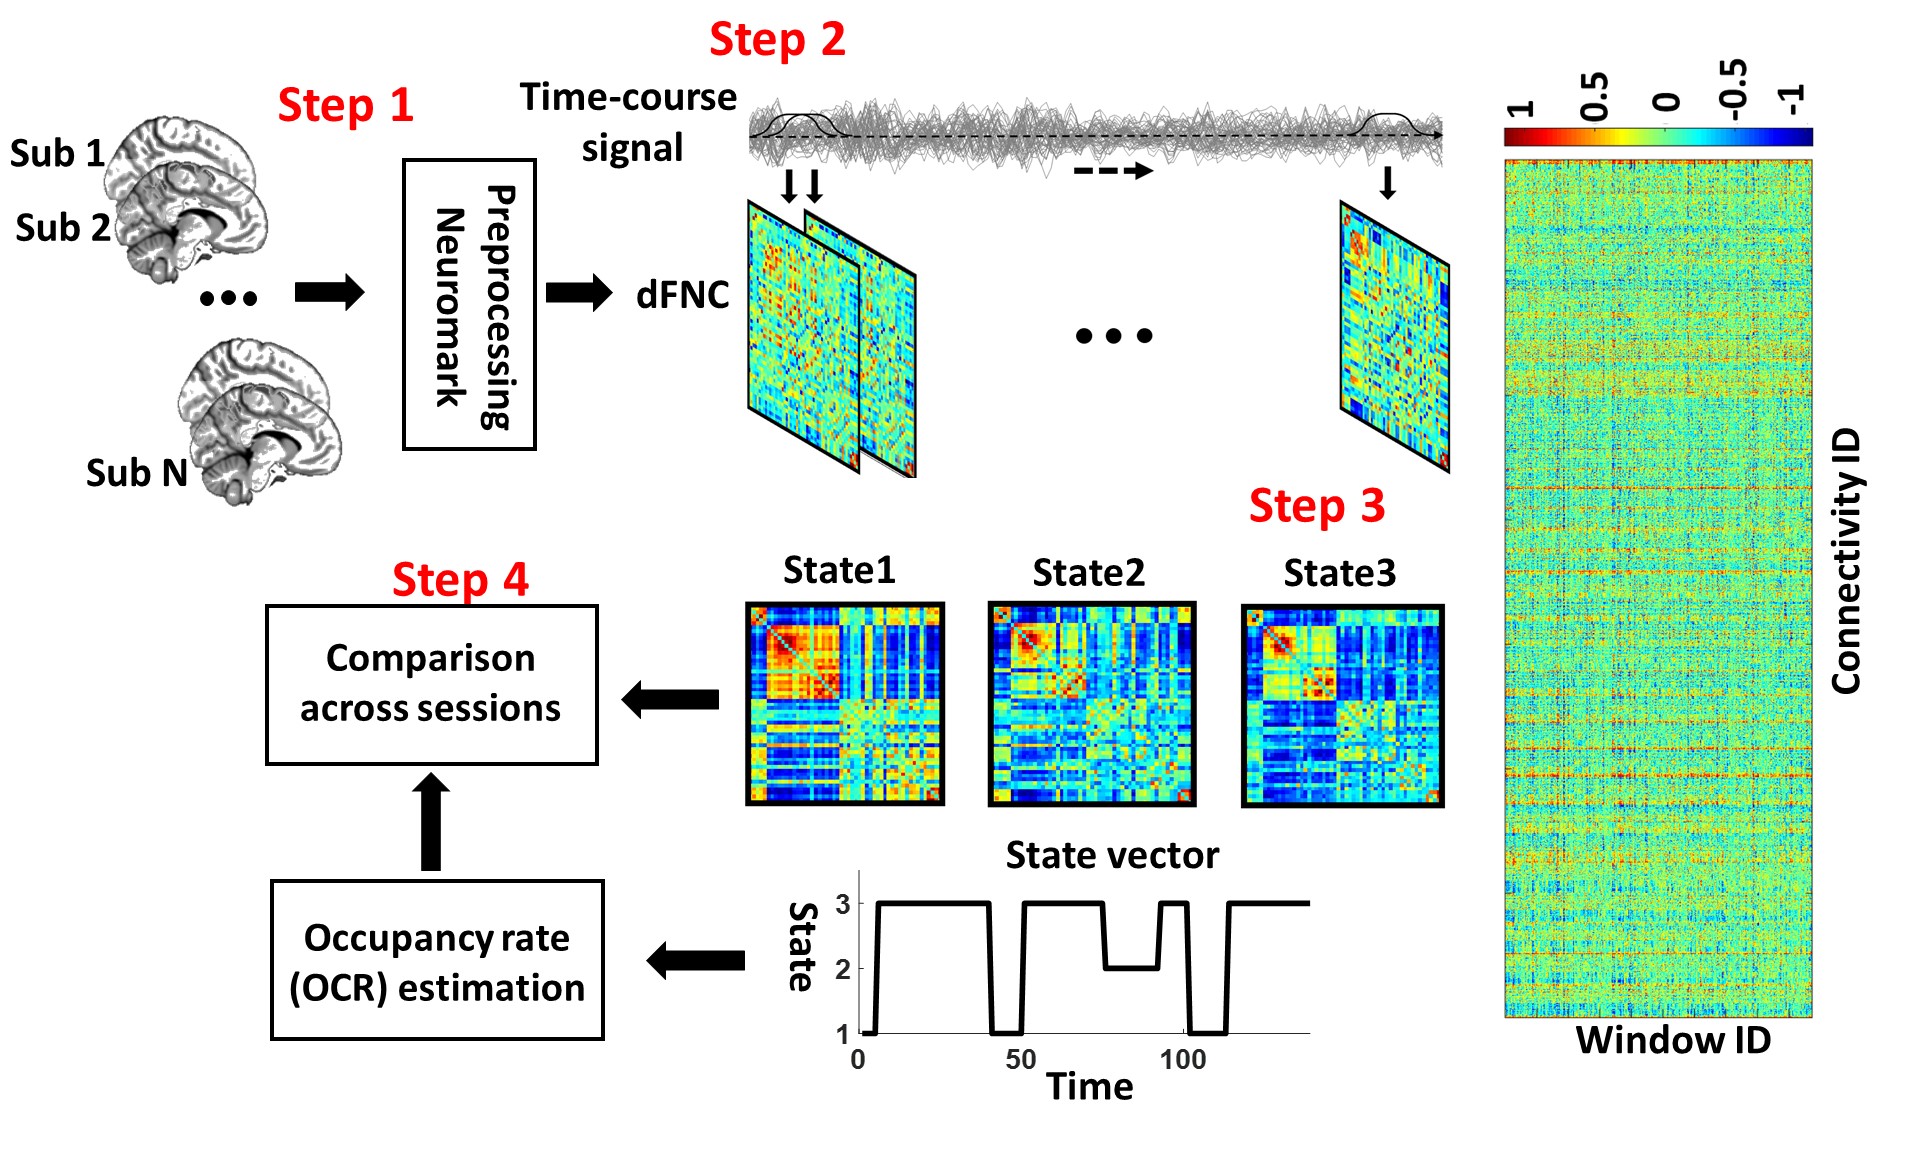
Fig.1: Analytic pipeline. Step1: The time-course signal of 53 ICNs have been identified using group-ICA in the Neuromark template. Step2: A taper sliding window was used to segment the time-course signals and then calculated the functional network connectivity (FNC). Each subject has 139 FNCs with a size of 53×53. Step3: A k-means clustering with correlation as distance metrics was used to group FNCs to three distinct clusters. Then, based on the state vector, we calculated the occupancy rate (OCR) for each subject. Step4: Finally, we compared the dFNC states across two sessions.
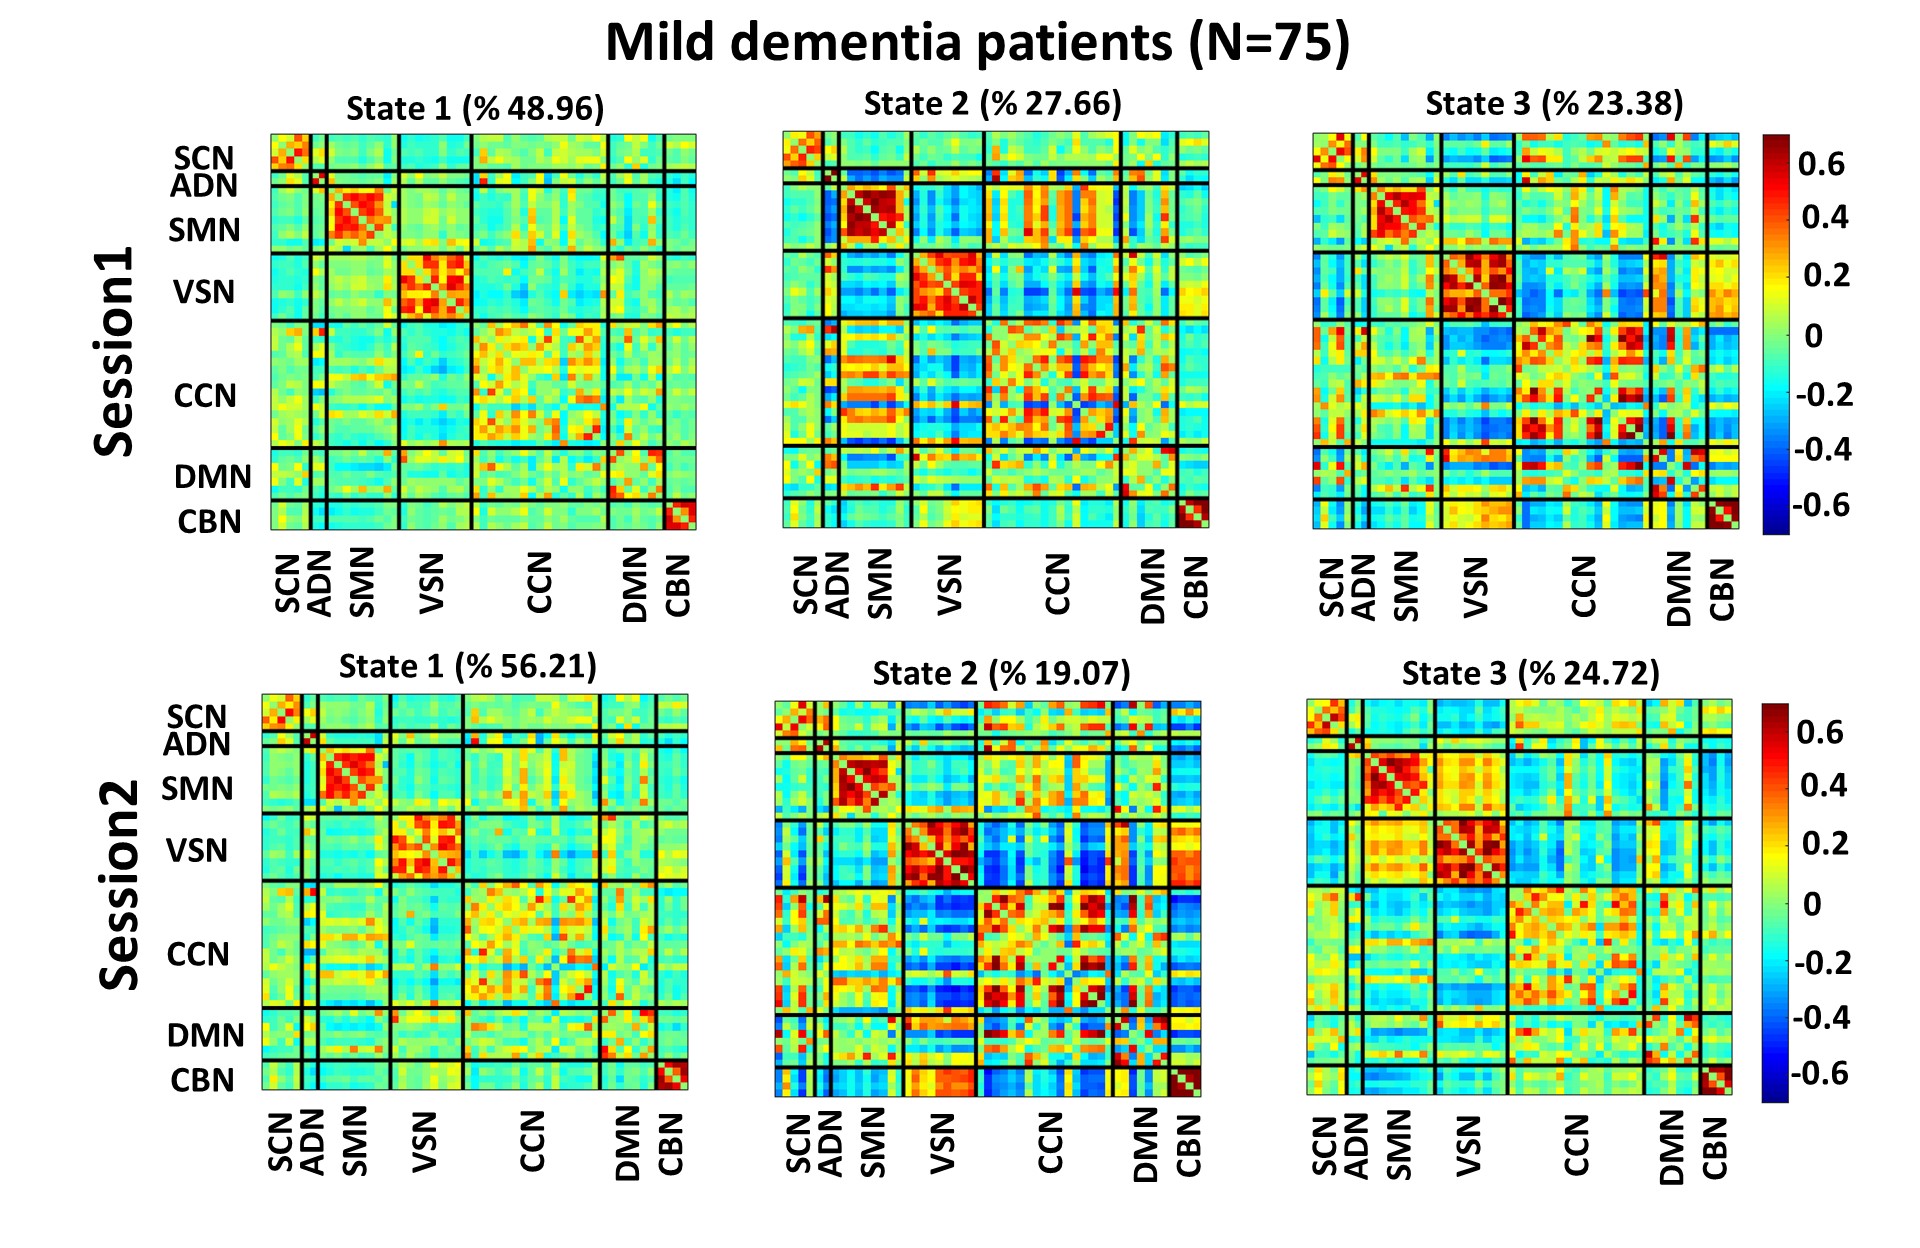
Fig. 5: Three identified states by k-means clustering methods for
mild dementia (MD) patients. The top panel shows the identified states in
sessions1, and the bottom panel shows the identified states in session2. The
color bar shows the strength of connectivity. The hot colors show positive and
cold colors show negative connectivity. SCN: Subcortical network, ADN: auditory
network, SMN: sensorimotor network, VSN: visual network, CCN: cognitive control
network, DMN: default-mode network, and CBN: cerebellar network.