Christopher D Rowley1,2, Ilana R Leppert2, Jennifer SW Campbell2, Filip Szczepankiewicz3,4, Stephen Nuara5, Markus Nilsson3, G Bruce Pike6, and Christine L Tardif1,2,7
1Neurology and Neurosurgery, McGill University, Montreal, QC, Canada, 2McConnell Brain Imaging Centre, Montreal Neurological Institute and Hospital, Montreal, QC, Canada, 3Diagnostic Radiology, Clinical Sciences Lund, Lund University, Lund, Sweden, 4Radiology, Brigham and Women's Hospital, Harvard Medical School, Boston, MA, United States, 5Comparative Medicine and Animal Resources Center, McGill University, Montreal, QC, Canada, 6Hotchkiss Brain Institute and Departments of Radiology and Clinical Neuroscience, University of Calgary, Calgary, AB, Canada, 7Department of Biomedical Engineering, McGill University, Montreal, QC, Canada
1Neurology and Neurosurgery, McGill University, Montreal, QC, Canada, 2McConnell Brain Imaging Centre, Montreal Neurological Institute and Hospital, Montreal, QC, Canada, 3Diagnostic Radiology, Clinical Sciences Lund, Lund University, Lund, Sweden, 4Radiology, Brigham and Women's Hospital, Harvard Medical School, Boston, MA, United States, 5Comparative Medicine and Animal Resources Center, McGill University, Montreal, QC, Canada, 6Hotchkiss Brain Institute and Departments of Radiology and Clinical Neuroscience, University of Calgary, Calgary, AB, Canada, 7Department of Biomedical Engineering, McGill University, Montreal, QC, Canada
We examine the use of
different myelin metrics, alongside linearly- and non-linearly encoded b-tensor
diffusion data for producing myelin volume fraction and axonal volume fraction
maps. These maps are used to compare WM g-ratio values in a marmoset.

Figure 4: Comparison
of microstructural maps that result from different myelin sensitive contrasts when
combined with outputs from the CODIVIDE model. These MVF maps report lower
values than the ones derived from NODDI outputs. While these AVF maps are quite
similar between myelin-metrics, they are strikingly different than the ones
from the NODDI output. Here, the contrast of the AVF maps has flipped with WM
presenting larger values than GM.
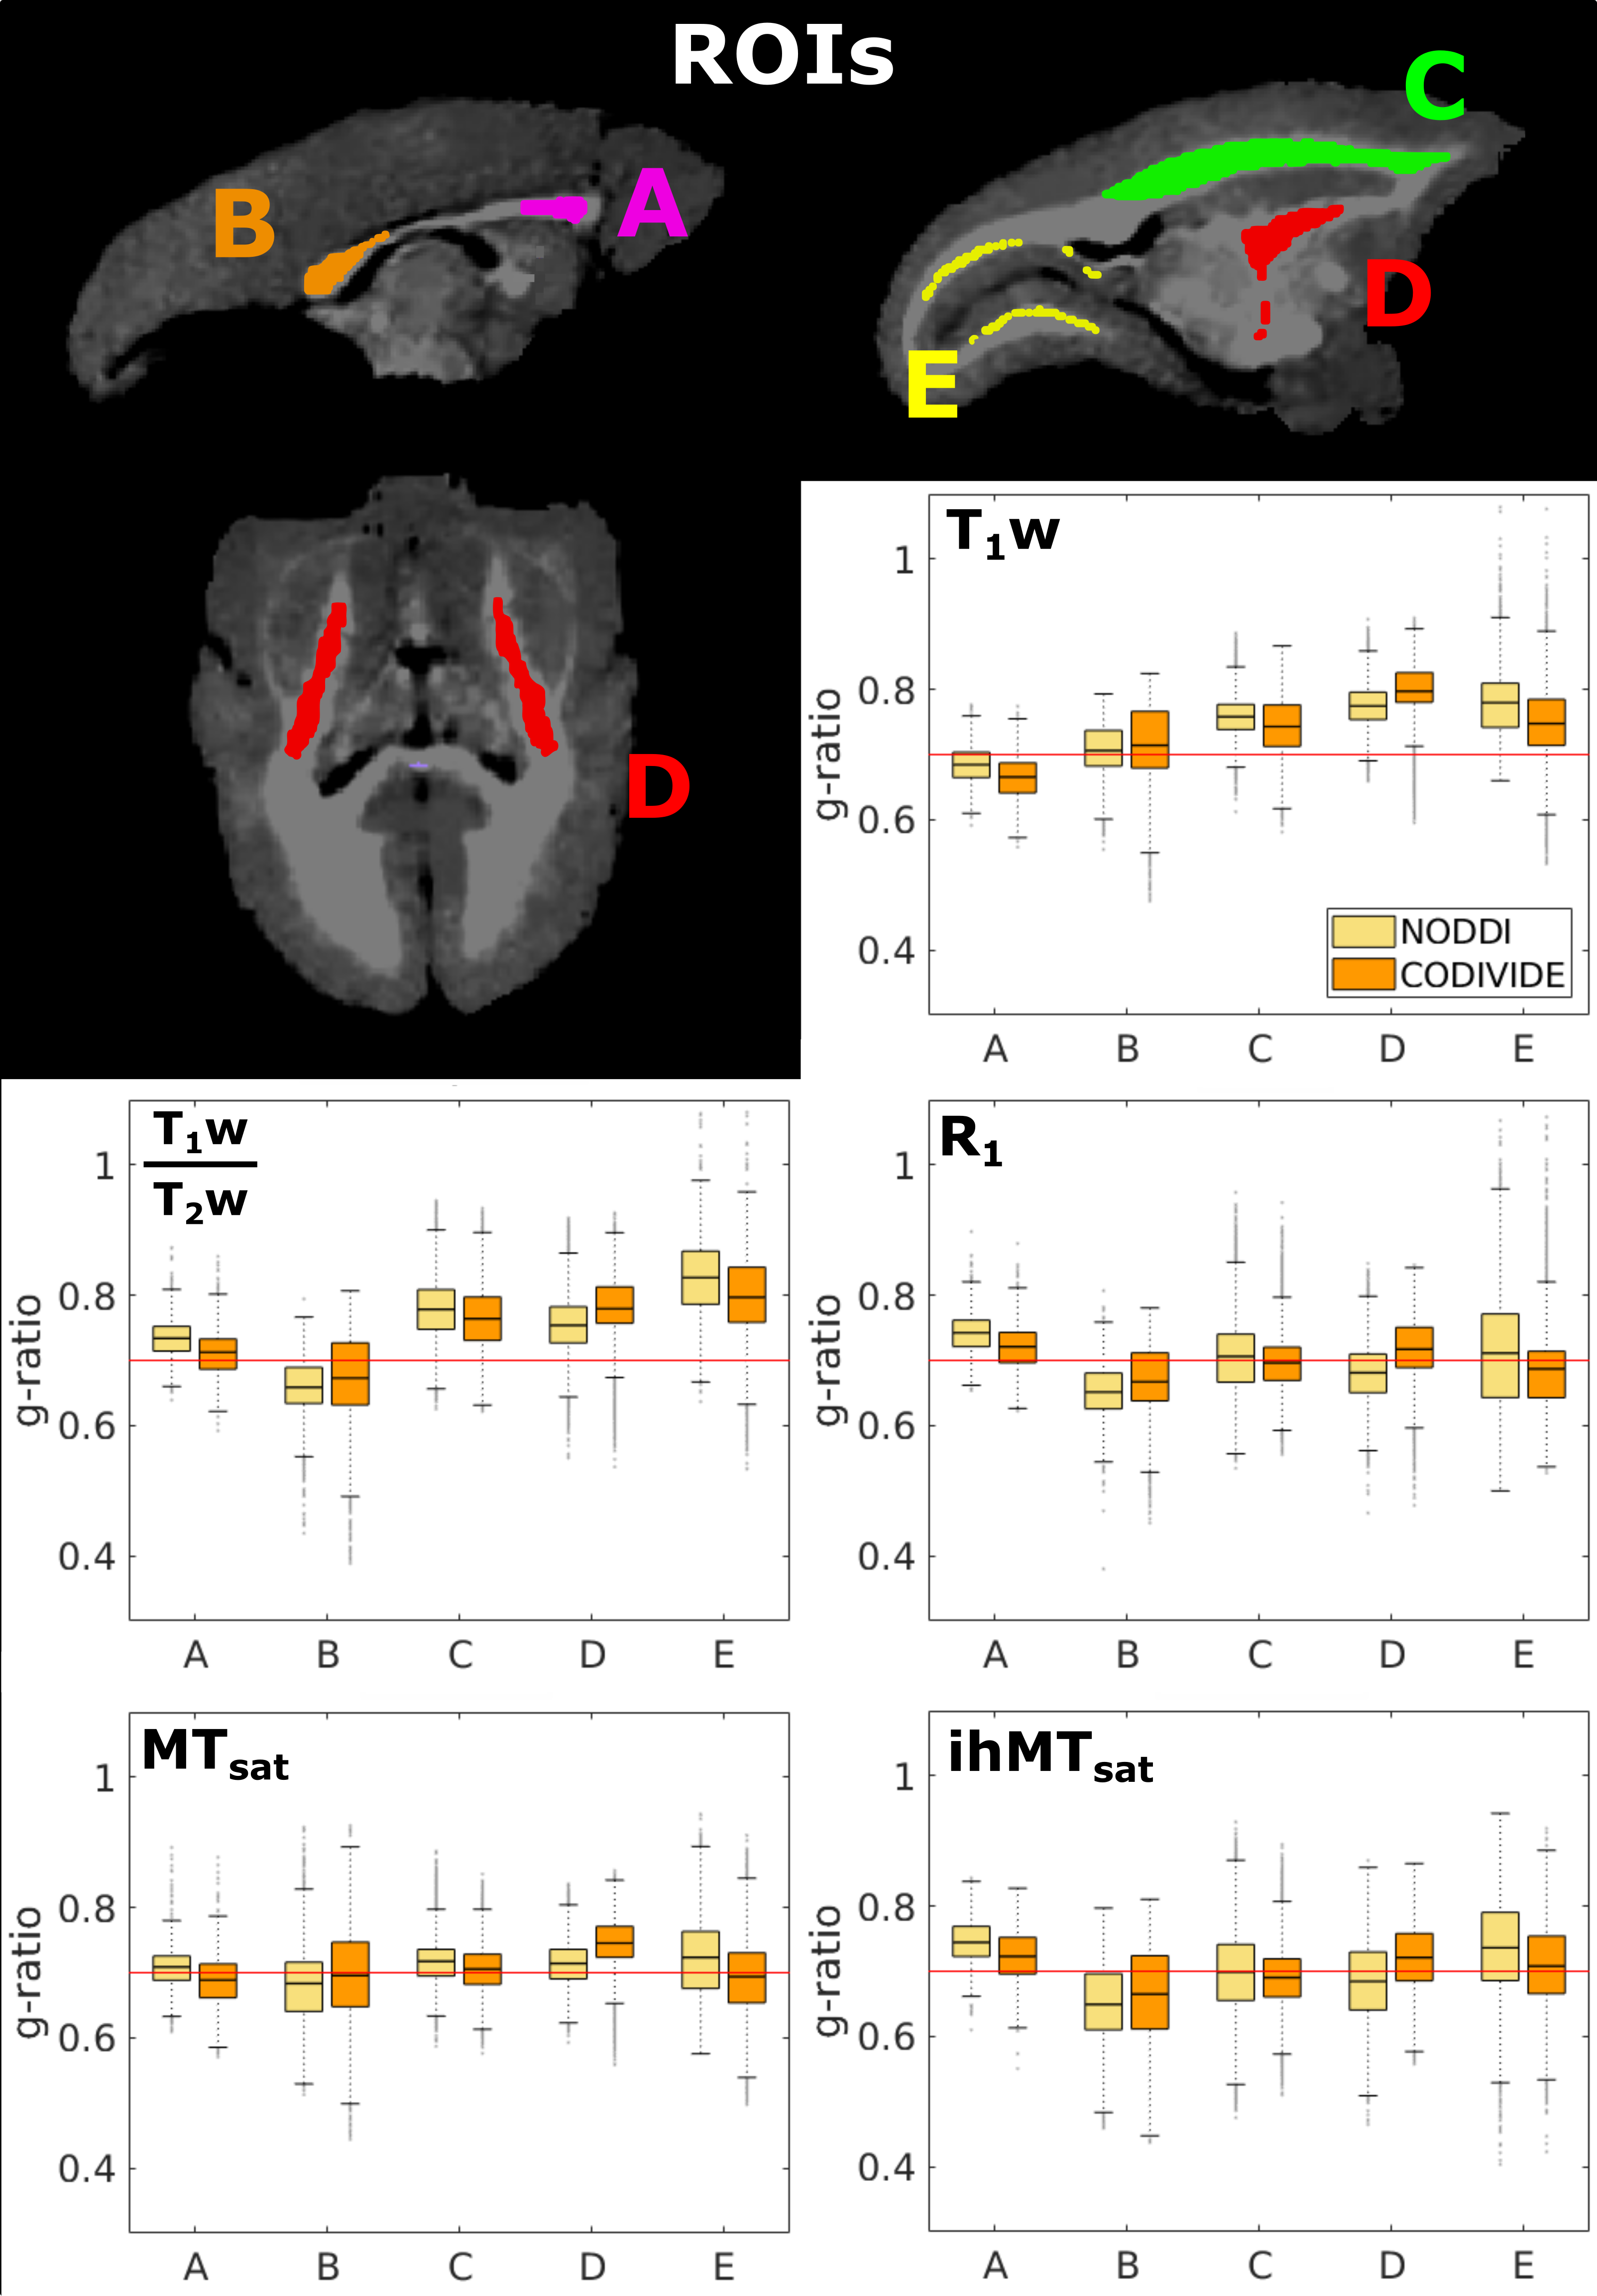
Figure 5: Boxplot
comparisons of g-ratio values calculated from different myelin-sensitive MRI
metrics, within several WM tracts. Each plot presents the g-ratio values
derived from one myelin-sensitive MRI metric with either NODDI or CODIVIDE
modelling of the diffusion data. The ROIs chosen are the genu (A) and splenium
(B) of the corpus callosum, the corona radiata (C), the internal
capsule (D), and the stratum calcarinum (E). The red line
indicates a g-ratio of 0.7.