Yixin Ma1,2, Trong-Kha Truong1,2, Iain P. Bruce1, Chun-Hung Yeh3, Jeffrey R. Petrella1,2, and Allen W. Song1,2
1Brain Imaging and Analysis Center, Duke University, Durham, NC, United States, 2Medical Physics Graduate Program, Duke University, Durham, NC, United States, 3Institute for Radiological Research, Chang Gung University and Chang Gung Memorial Hospital, Taoyuan, Taiwan
1Brain Imaging and Analysis Center, Duke University, Durham, NC, United States, 2Medical Physics Graduate Program, Duke University, Durham, NC, United States, 3Institute for Radiological Research, Chang Gung University and Chang Gung Memorial Hospital, Taoyuan, Taiwan
We use a column-based method that samples submillimeter whole-brain DTI data along cortical columns to achieve a robust quantitative analysis of the diffusion anisotropy dependence on the cortical depth, curvature, and brain regions across the brain.
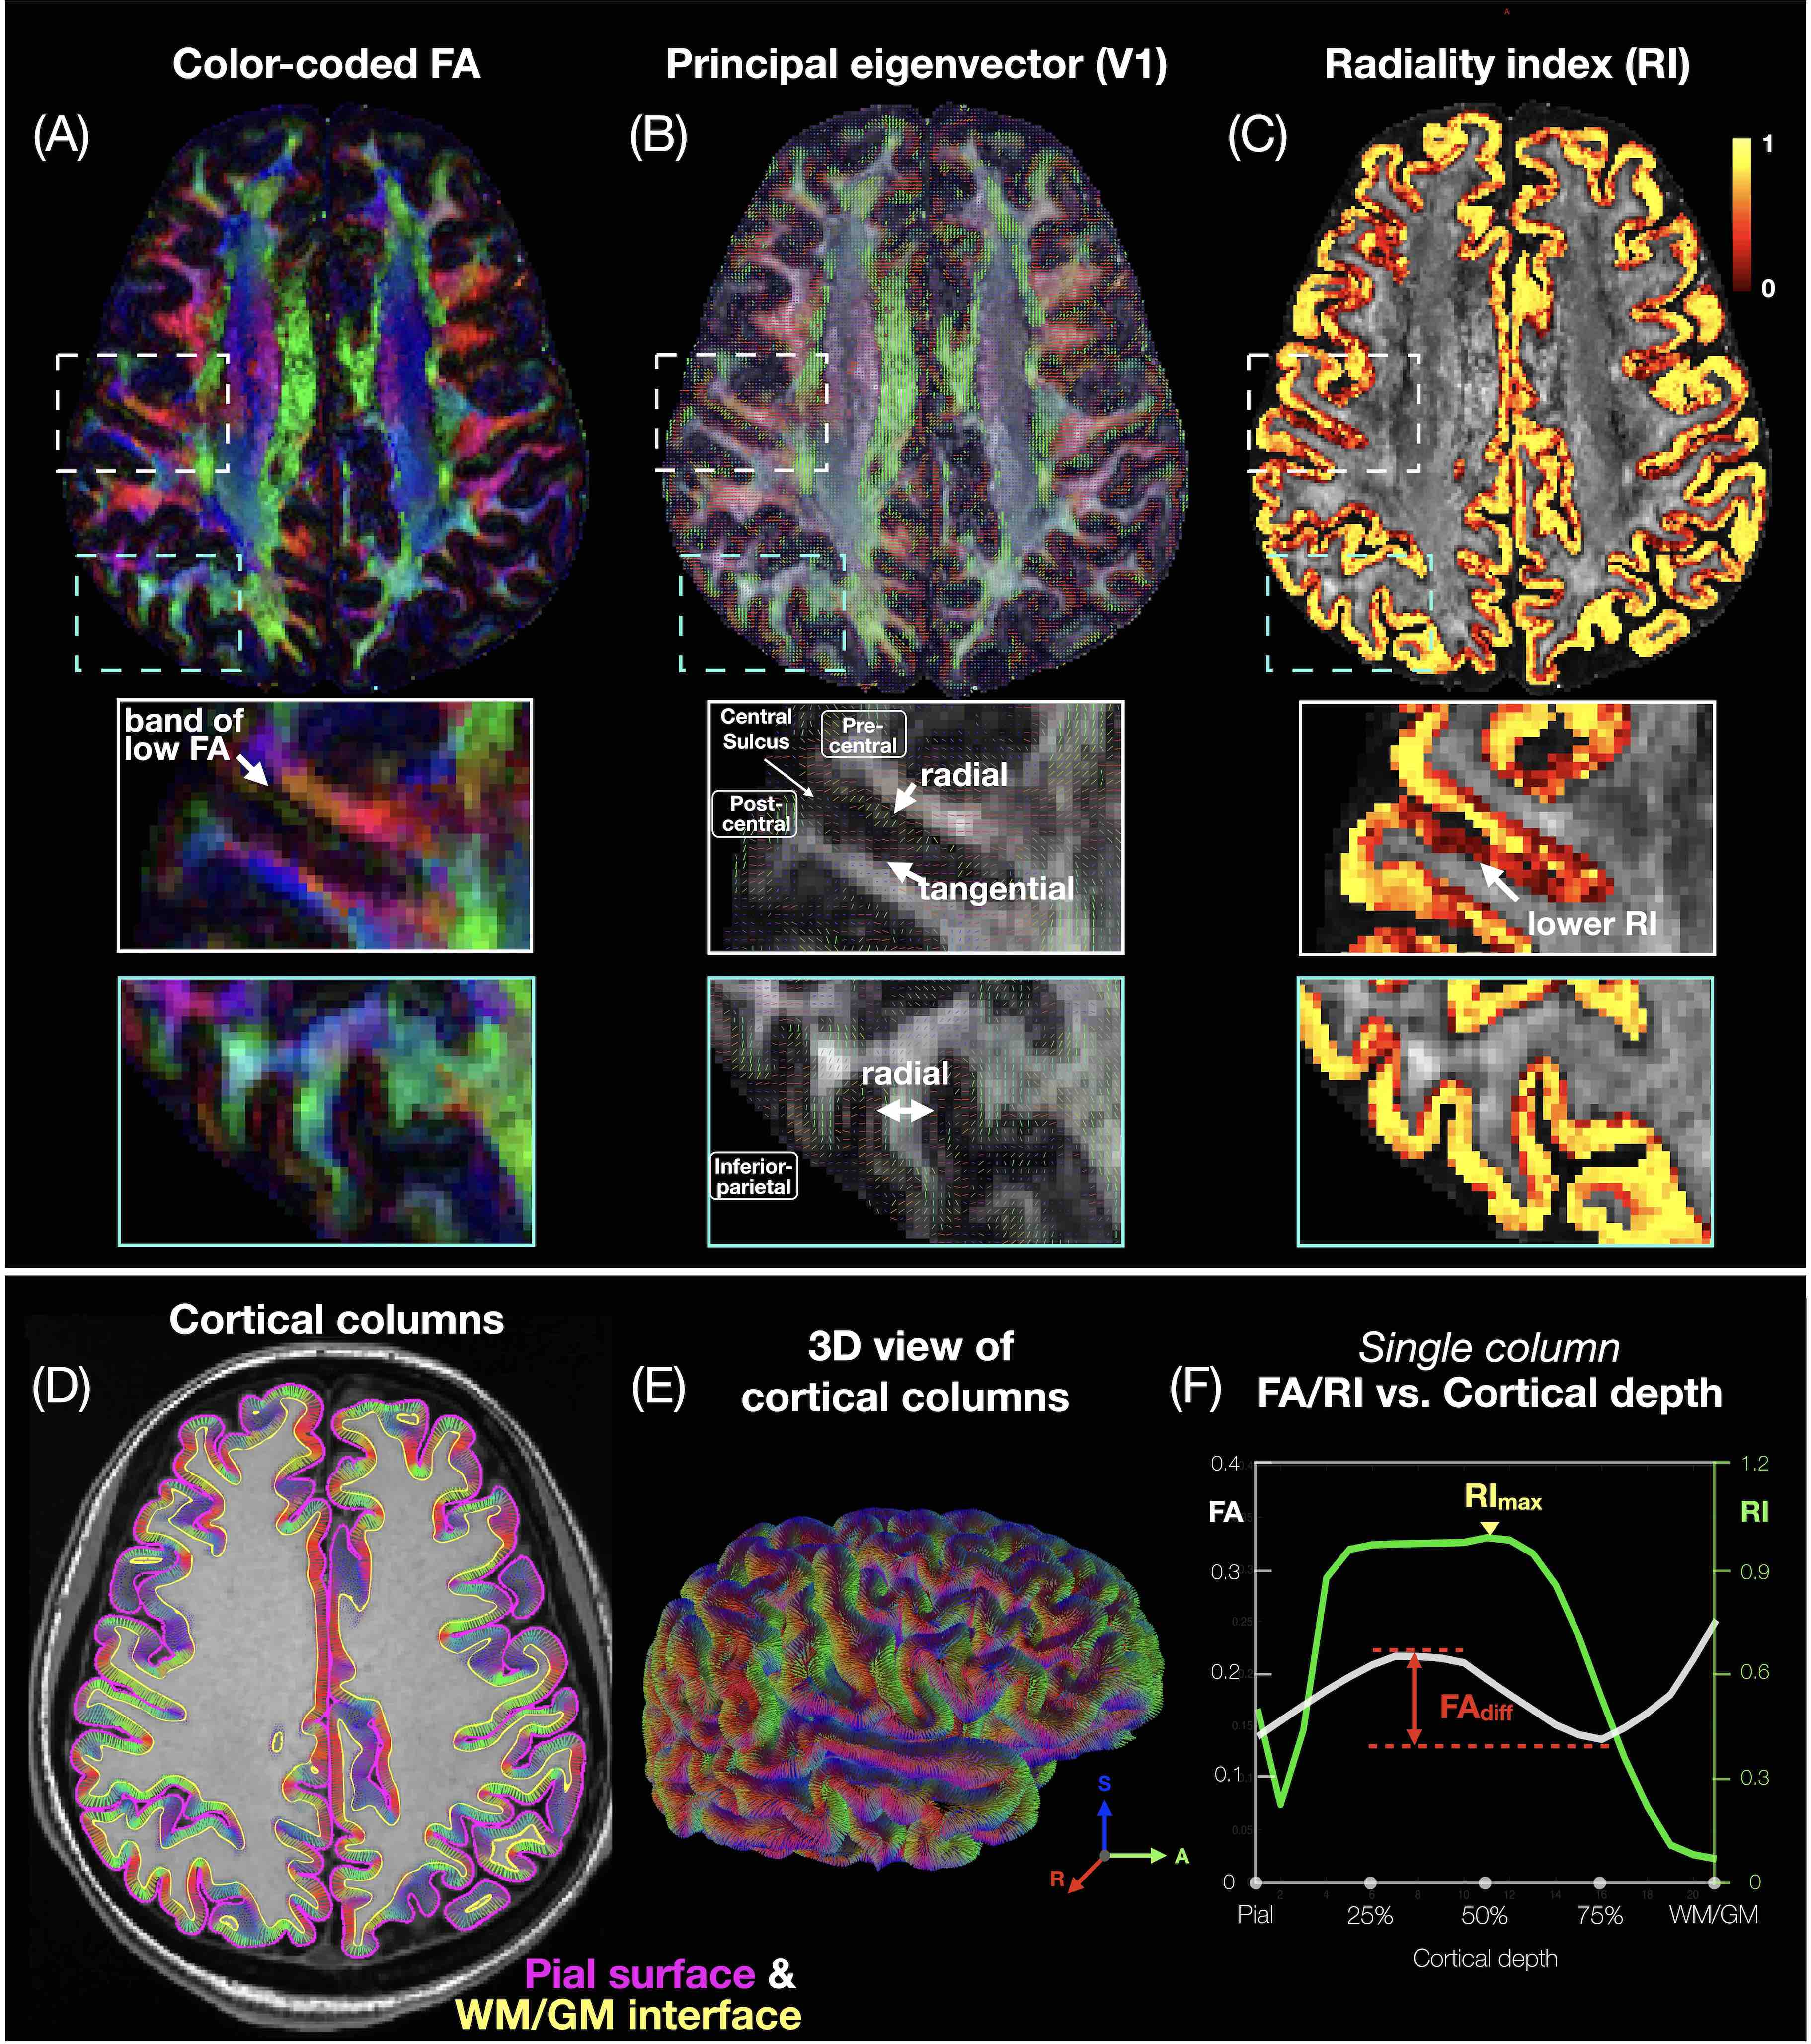
Fig.1: (A) Color-coded FA, (B) principal eigenvector, and (C) RI maps overlaid on FA, showing a band of low FA and a radial diffusion orientation in most cortical regions, but a tangential orientation and lower RI in the post-central gyrus. (D) Axial and (E) 3D views of cortical columns connecting the pial surface mesh and the WM/GM surface mesh. (F) Single-column FA/RI vs. cortical depth profiles showing an FA local maximum and minimum (separated by FAdiff) and a single RI maximum (RImax).
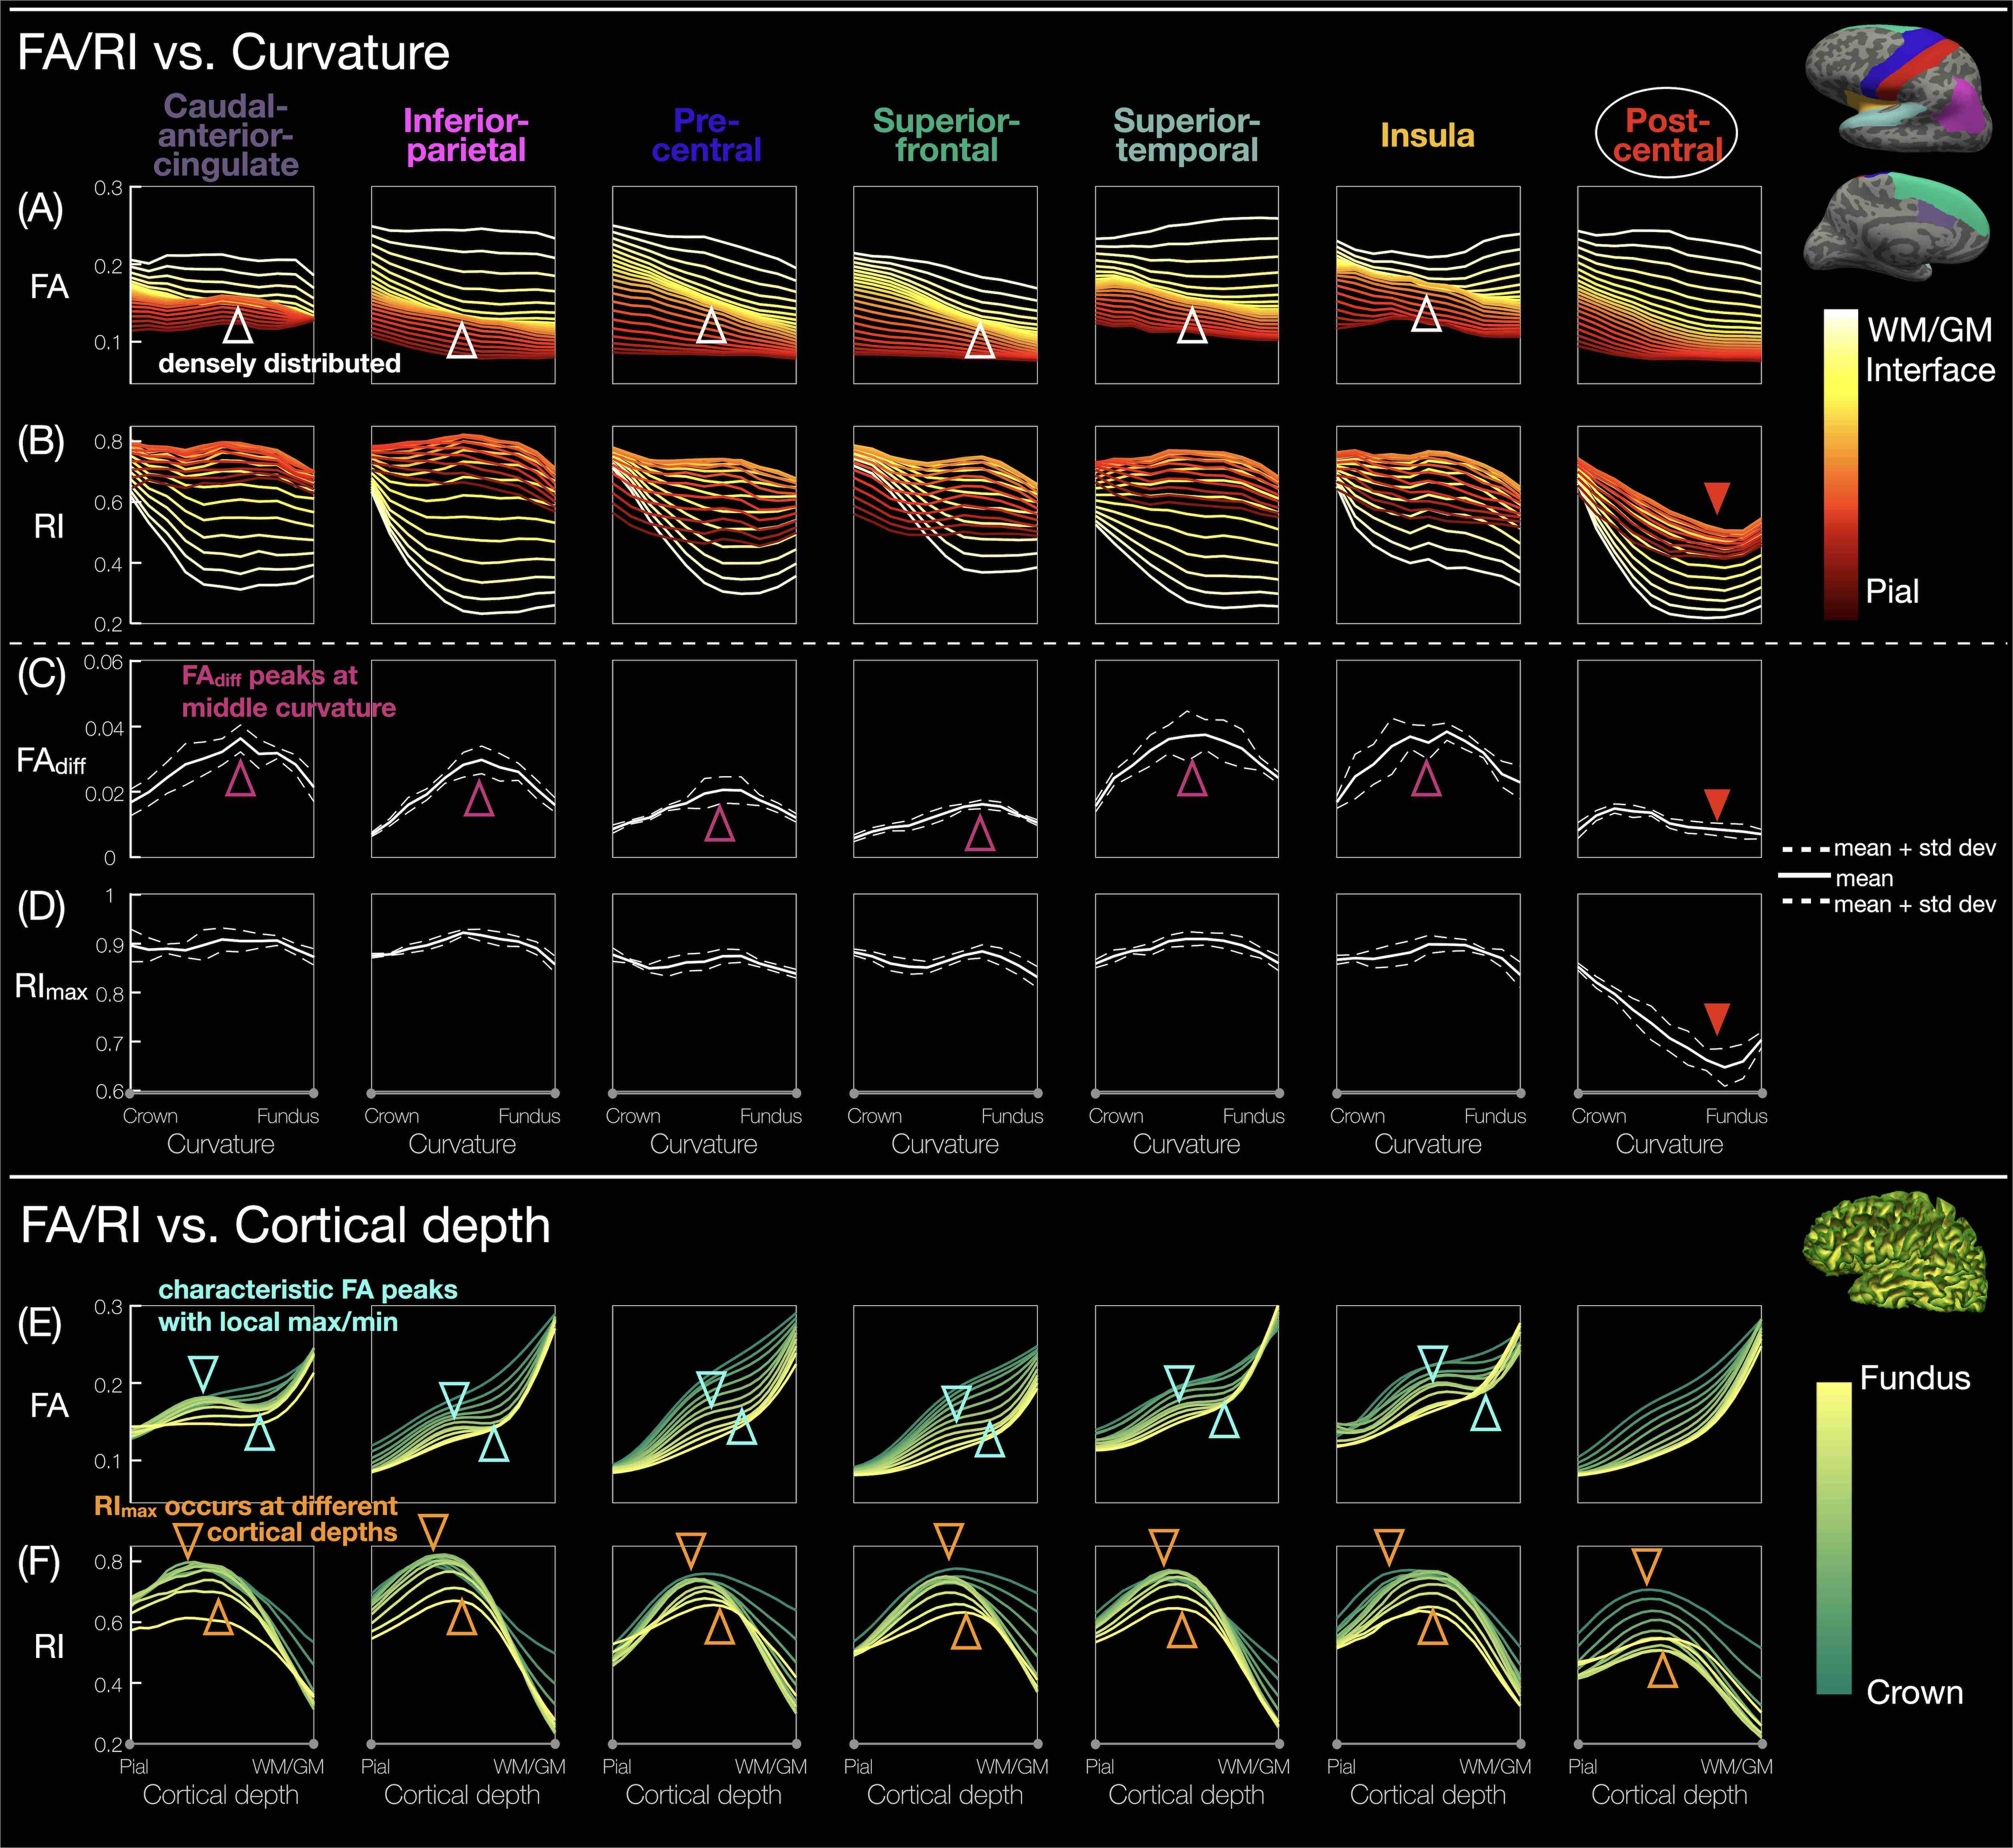
Fig.5: (A,B) FA/RI vs. curvature at different cortical depths. (C,D) FAdiff/RImax vs. curvature. (E,F) FA/RI vs. cortical depth at different curvatures. The denser profiles in A correspond to the FA and FAdiff peaks in E and C (white/green/magenta arrowheads). RI decreases from crown to fundus more drastically at larger cortical depths, while RImax occurs at smaller cortical depths towards the crown (orange arrowheads). The post-central ROI shows a lower RI/RImax and FAdiff (red arrowheads).