Gilbert Hangel1,2, Benjamin Spurny3, Philipp Lazen2, Cornelius Cadrien1,2, Sukrit Sharma2, Zoe Käfer2, Nikolaus Doblinger2, Lukas Hingerl2, Eva Hečková2, Bernhard Strasser2, Stanislav Motyka2, Alexandra Lipka2, Stephan Gruber2, Christoph Brandner4, Rupert Lanzenberger3, Karl Rössler1, Siegfried Trattnig2,5, and Wolfgang Bogner2
1Department of Neurosurgery, Medical University of Vienna, Vienna, Austria, 2High Field MR Centre, Department of Biomedical Imaging and Image-guided Therapy, Medical University of Vienna, Vienna, Austria, 3Division of General Psychiatry, Department of Psychiatry and Psychotherapy, Medical University of Vienna, Vienna, Austria, 4High Field MR Centre, Centre for Medical Physics and Biomedical Engineering, Medical University of Vienna, Vienna, Austria, 5Christian Doppler Laboratory for Clinical Molecular MR Imaging, Vienna, Austria
1Department of Neurosurgery, Medical University of Vienna, Vienna, Austria, 2High Field MR Centre, Department of Biomedical Imaging and Image-guided Therapy, Medical University of Vienna, Vienna, Austria, 3Division of General Psychiatry, Department of Psychiatry and Psychotherapy, Medical University of Vienna, Vienna, Austria, 4High Field MR Centre, Centre for Medical Physics and Biomedical Engineering, Medical University of Vienna, Vienna, Austria, 5Christian Doppler Laboratory for Clinical Molecular MR Imaging, Vienna, Austria
Using 7T 3D-CRT-FID-MRSI, we successfully
determined metabolite concentration estimates and their coefficients of
variation for 13 metabolites in 44 brain regions for healthy volunteers.
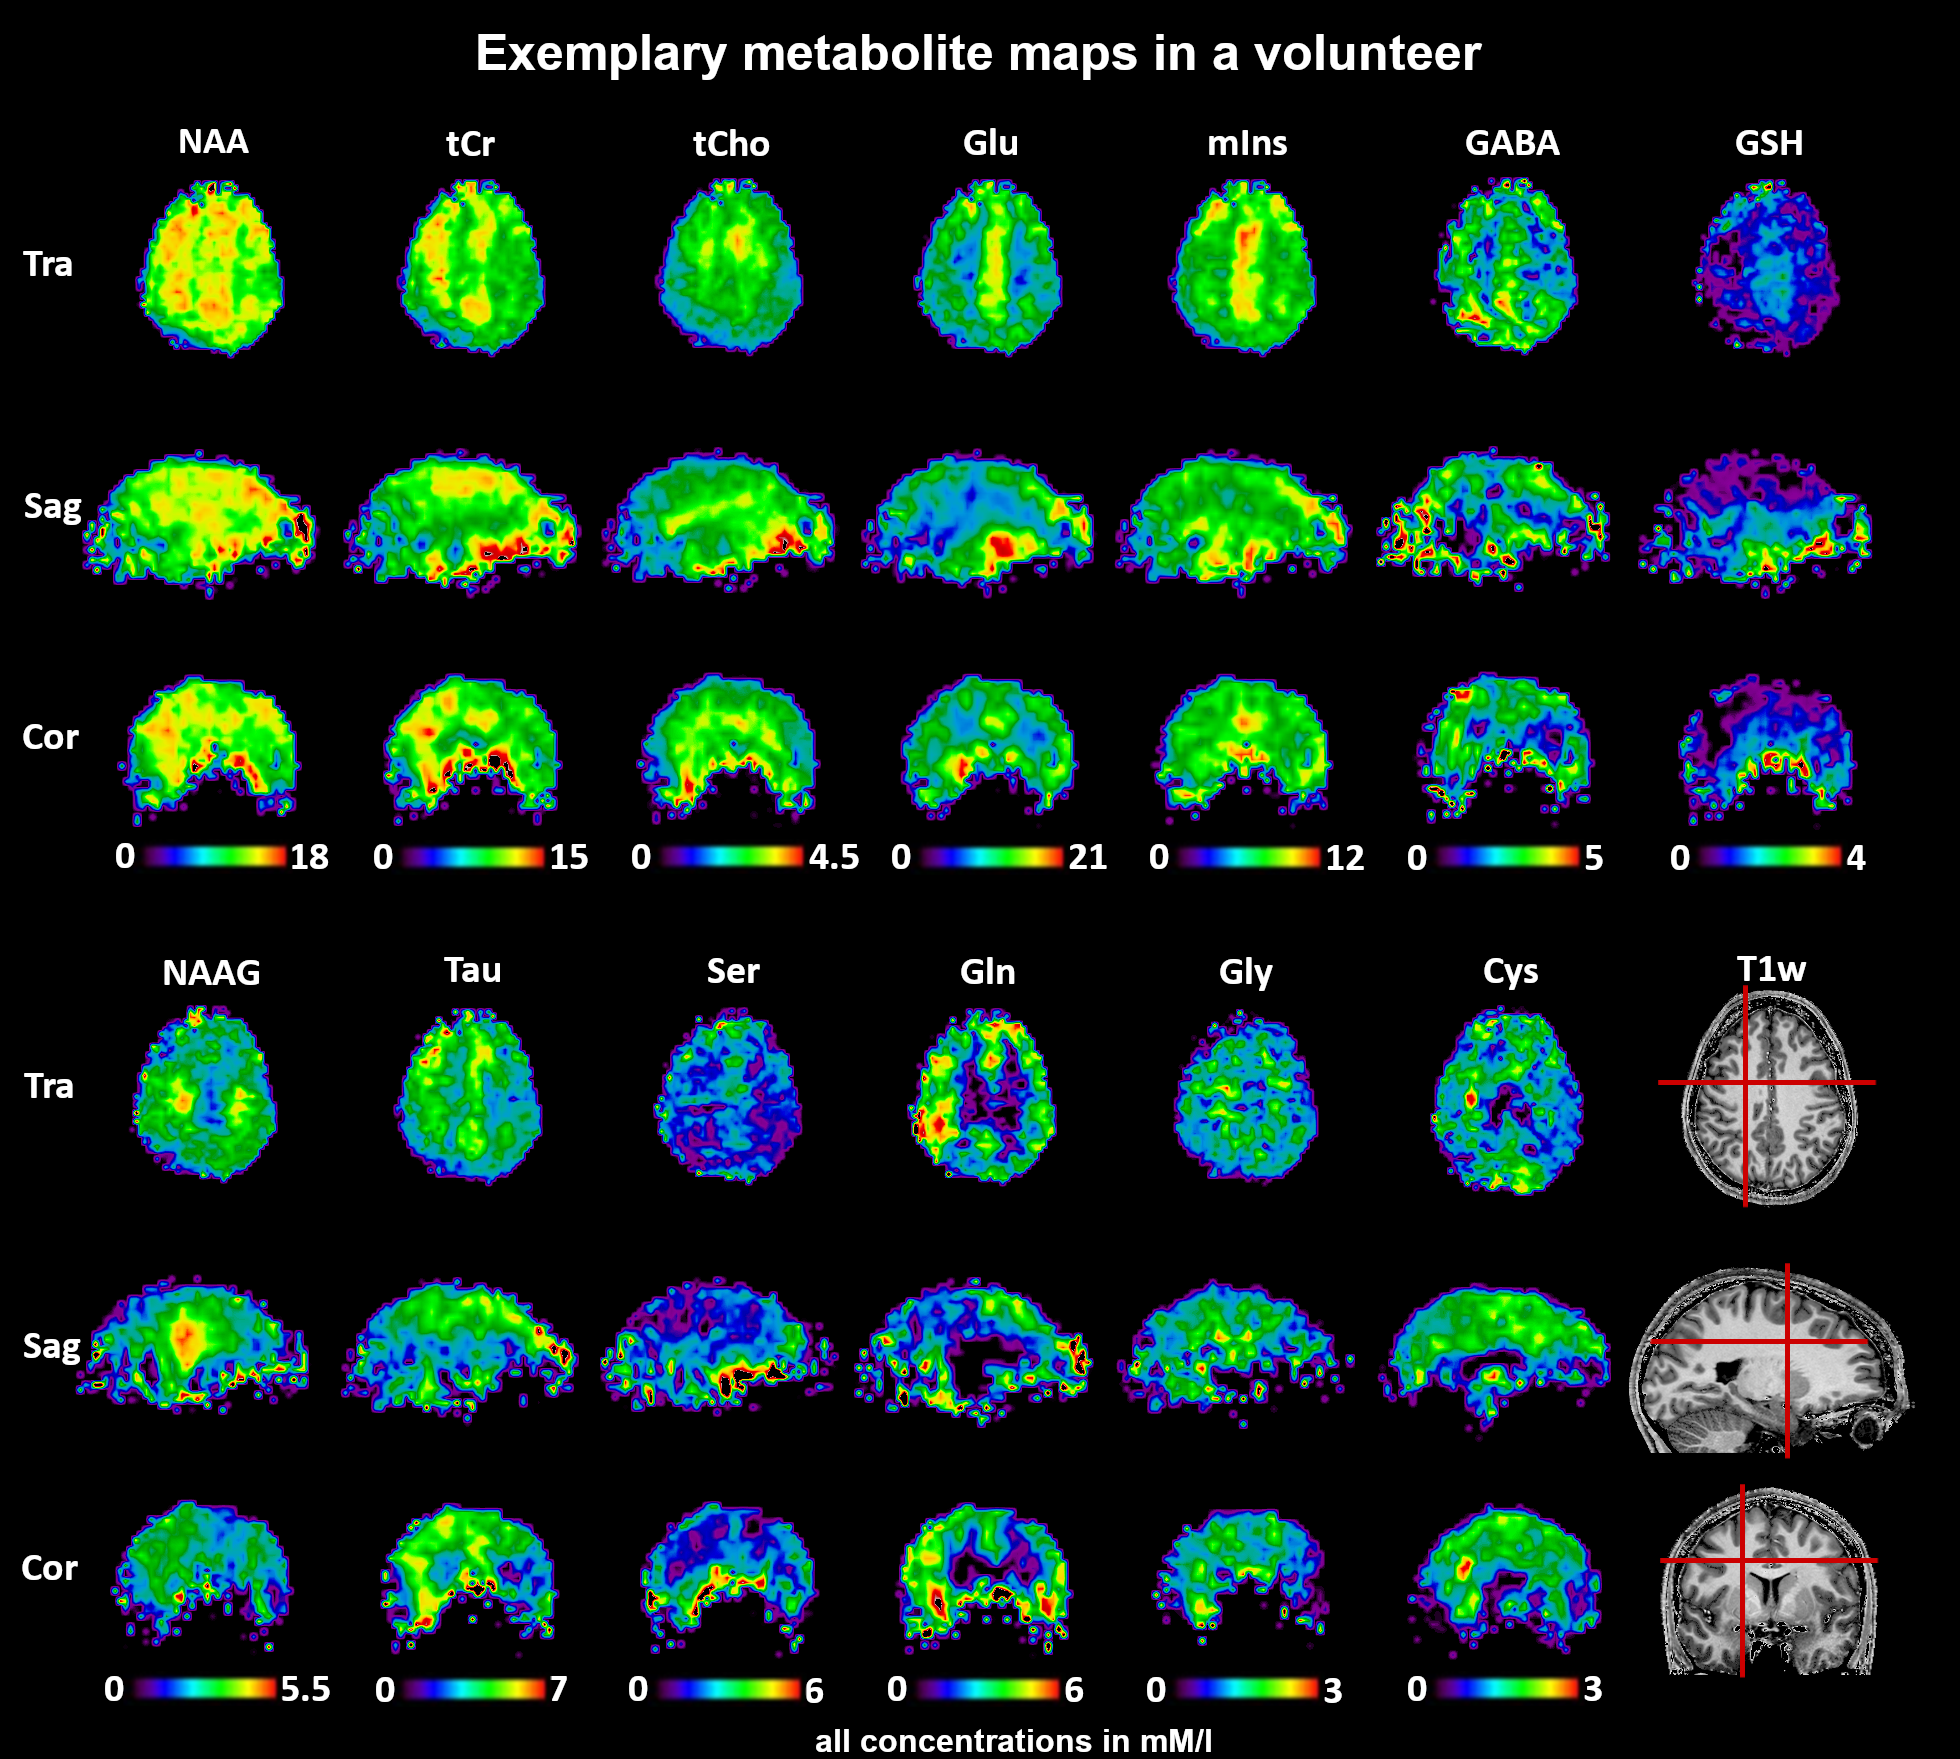
Figure 2: Exemplary
concentration estimate maps of all successfully quantified metabolites in one
subject. For lower SNR-metabolites, more artifacts or regions without successful
quantification are visible. Good visibility of GM/WM and regional variations
can be seen especially for neurotransmitters.
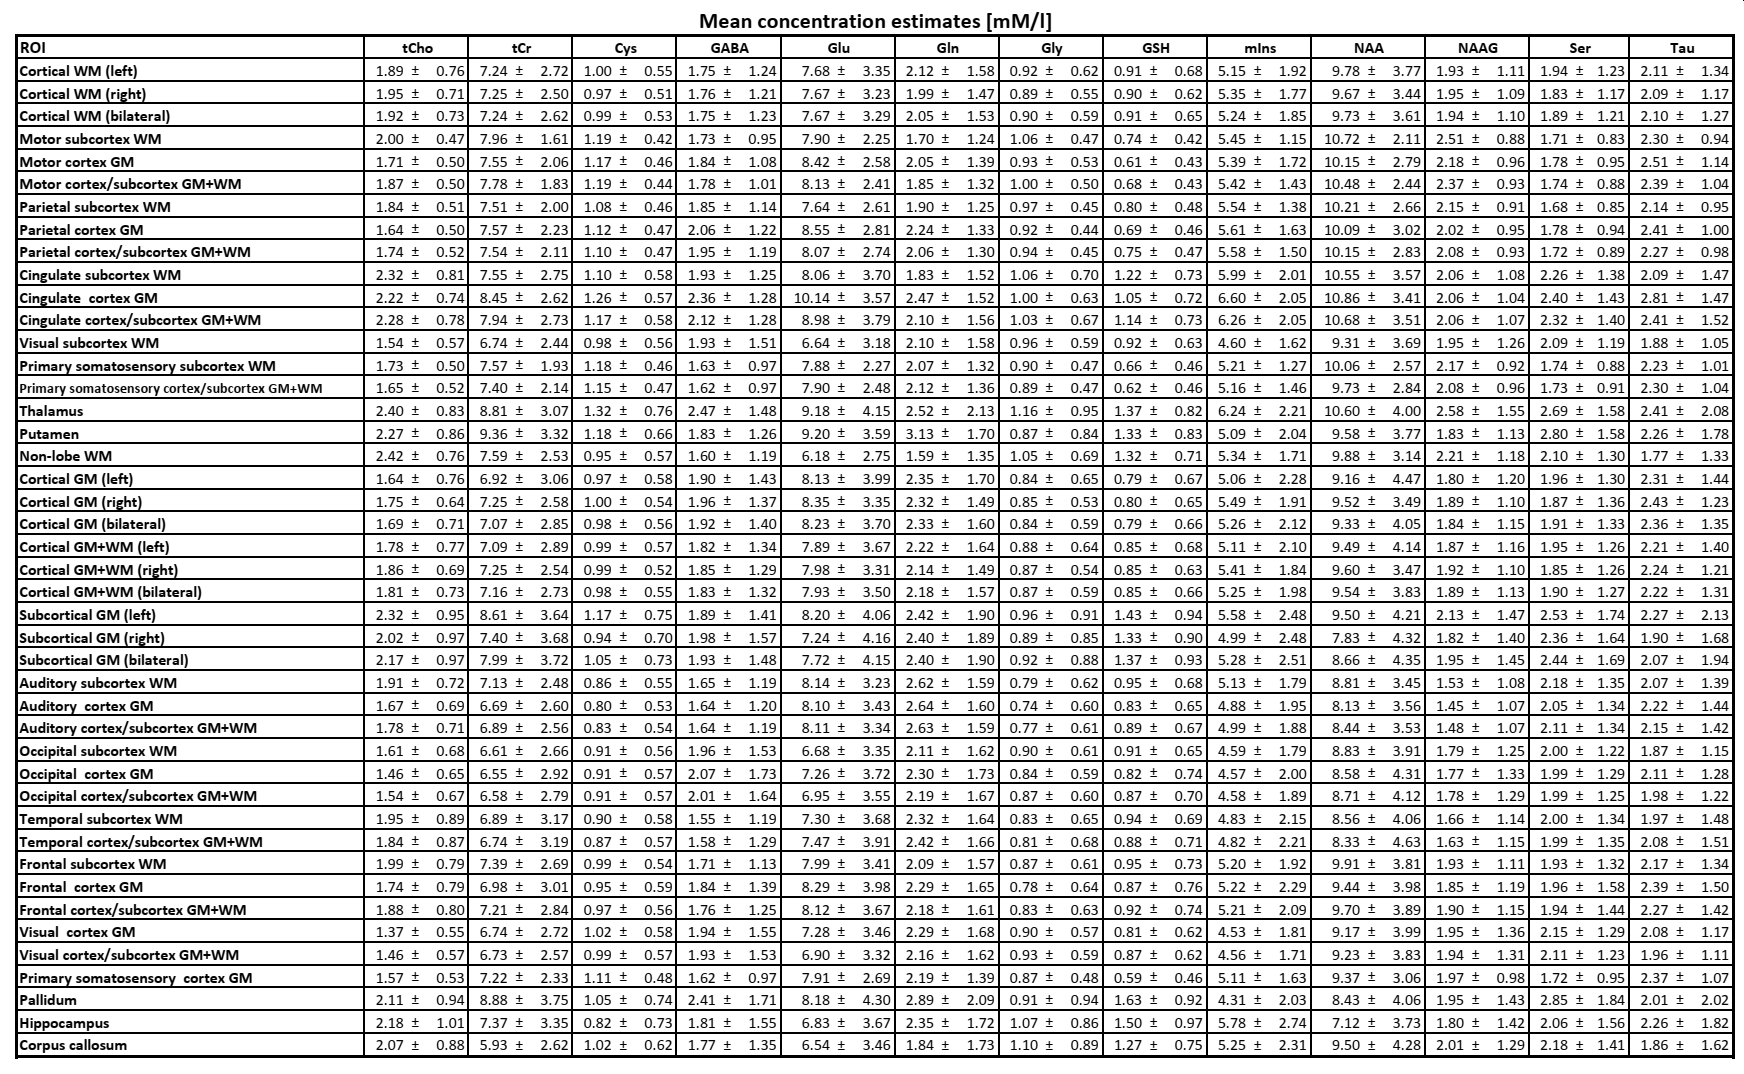
Figure 3: Mean
concentration estimates per ROI in [mM/l] for successfully quantified
metabolites in all ROIs qualified as defined in Fig.1.