1High-Field MR Center, Max Planck Institute for Biological Cybernetics, Tübingen, Germany, 2Advanced Imaging Research Center, UT Southwestern Medical Center, Dallas, TX, United States
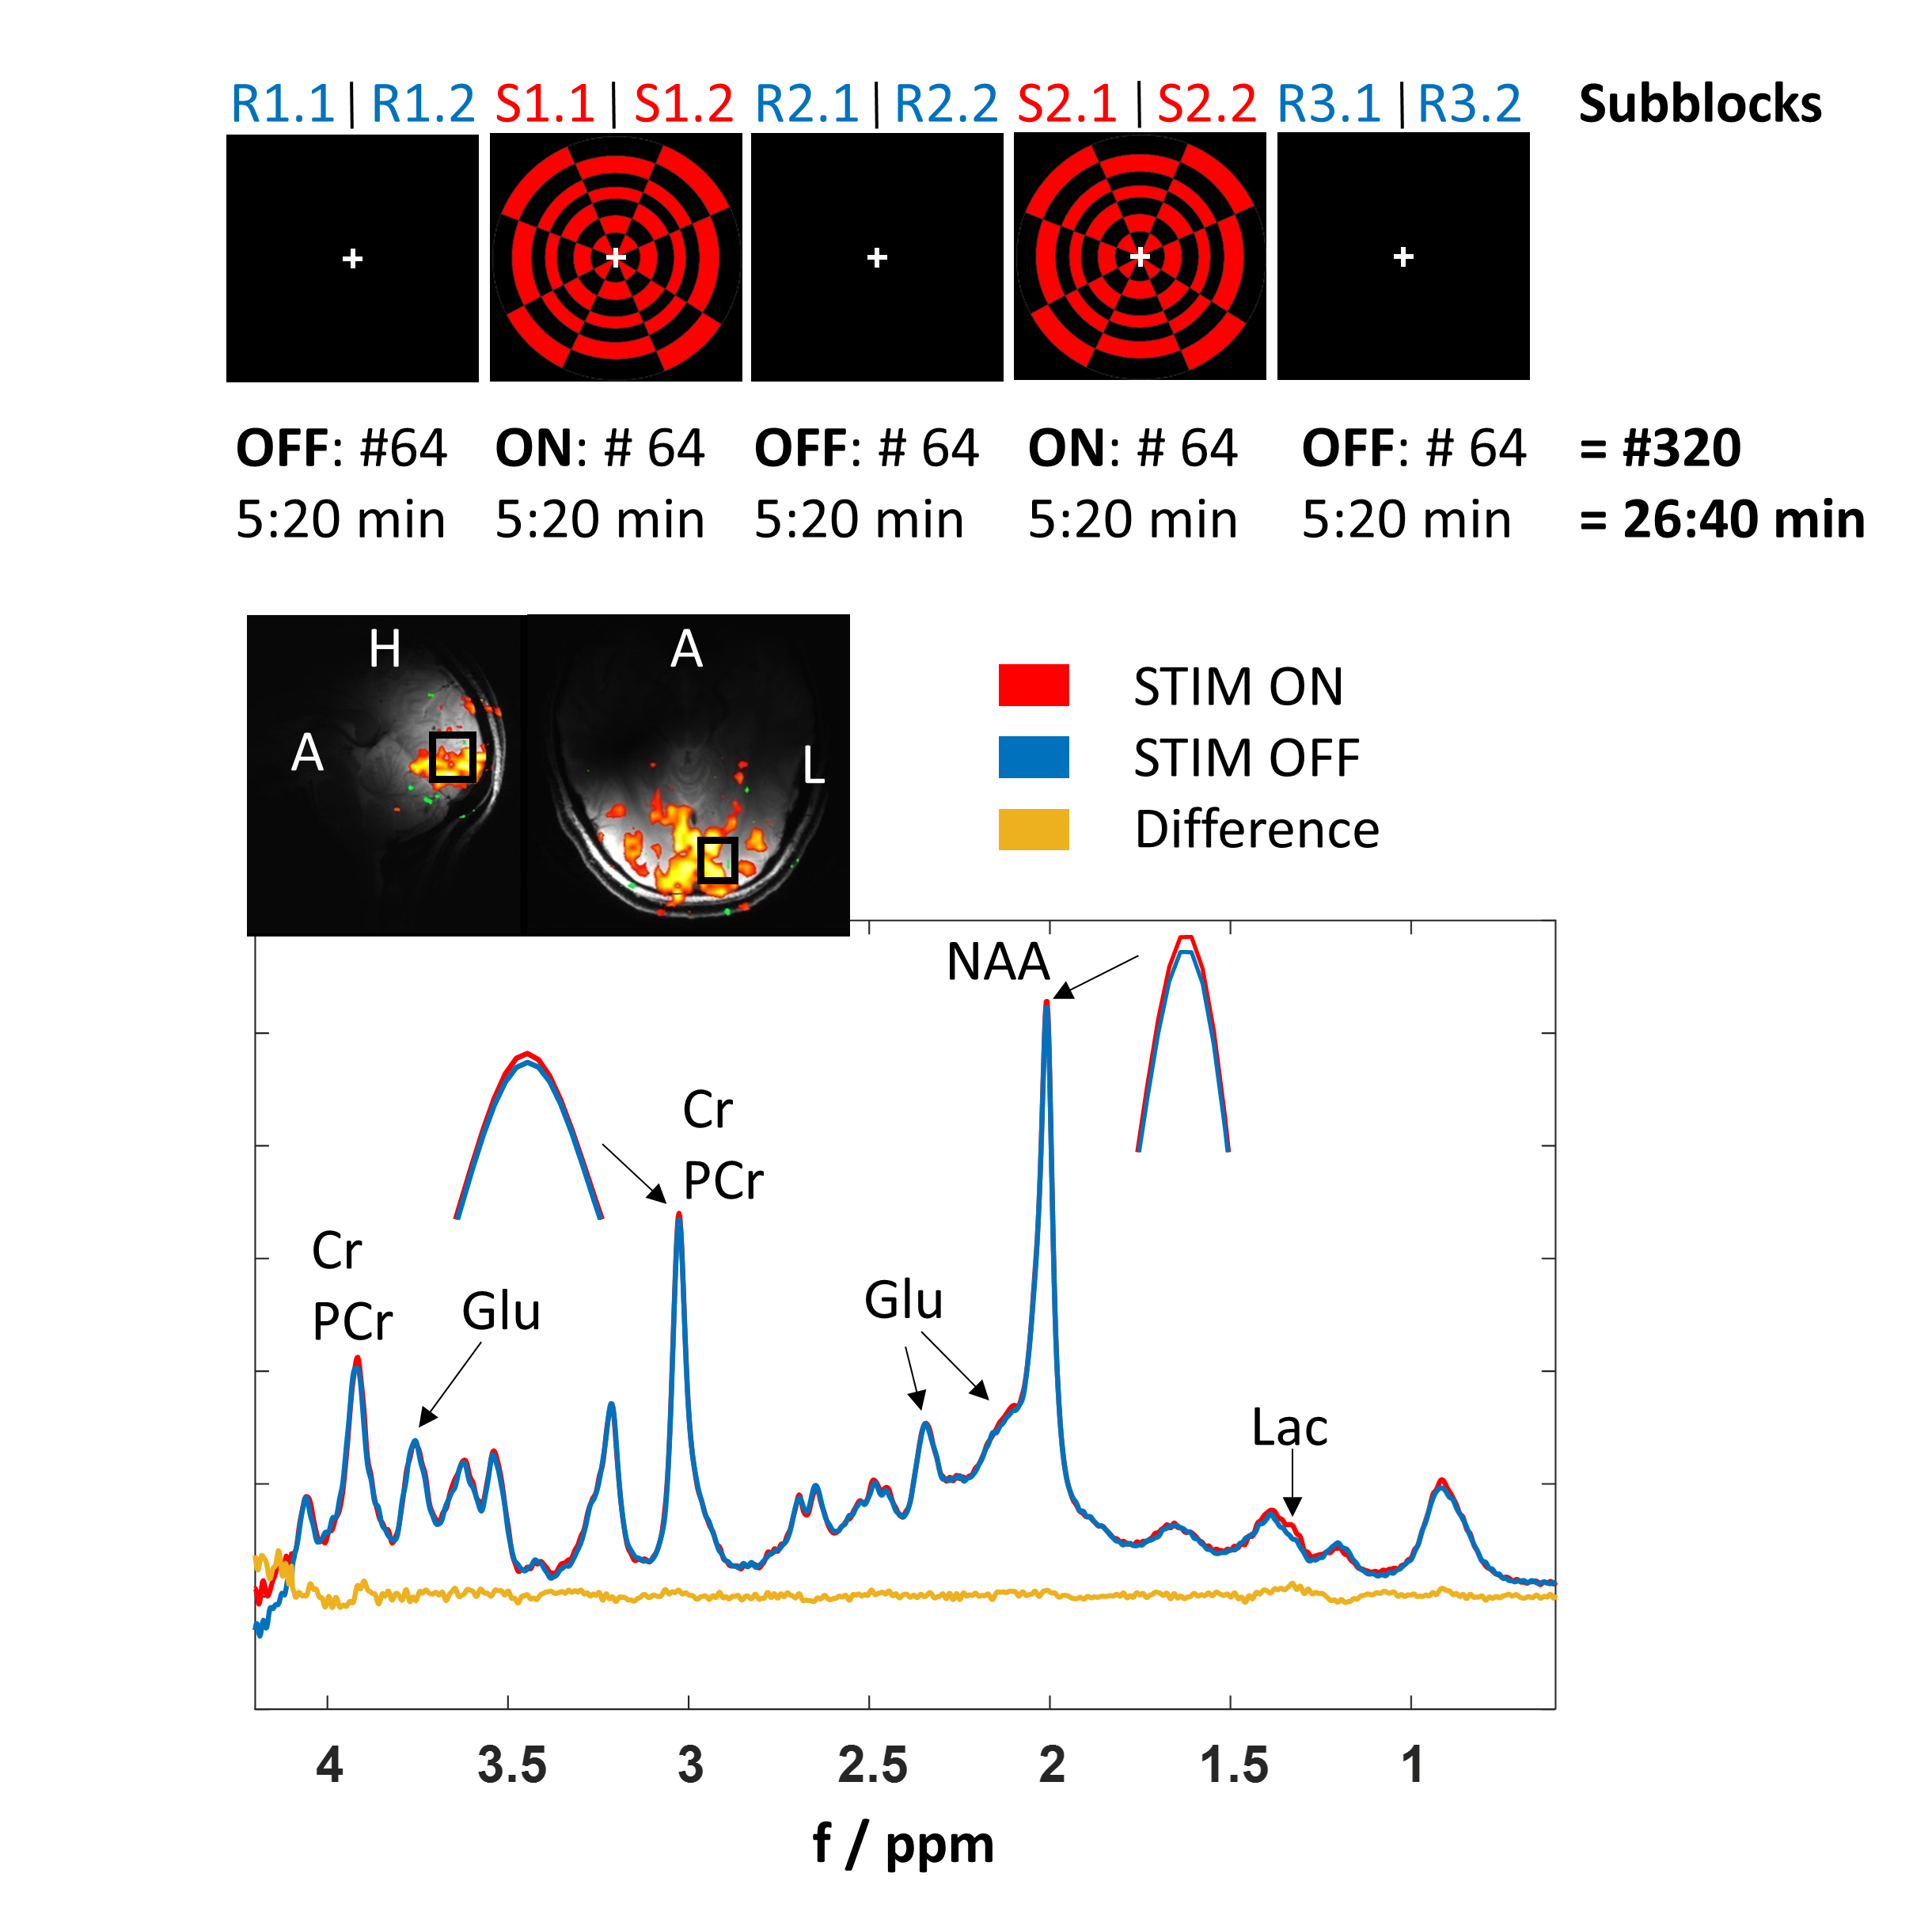
Figure 1: Top: Schematic diagram of the fMRS visual stimulation paradigm using a red-black checkerboard pattern. Numbers indicate the acquired number of averages per block and needed acquisition time. FLASH insets below show the BOLD activated region and the fMRS voxel placement (15x18x20 mm3).
Bottom: Representative MR spectra from one volunteer acquired during STIM (red, S1.2/S2.2) and REST (blue, R2.2/R3.2) periods (64 averages each spectrum) and the difference spectrum (yellow). Small amplitude and linewidth changes of Cr+PCr and NAA indicate the BOLD effect.
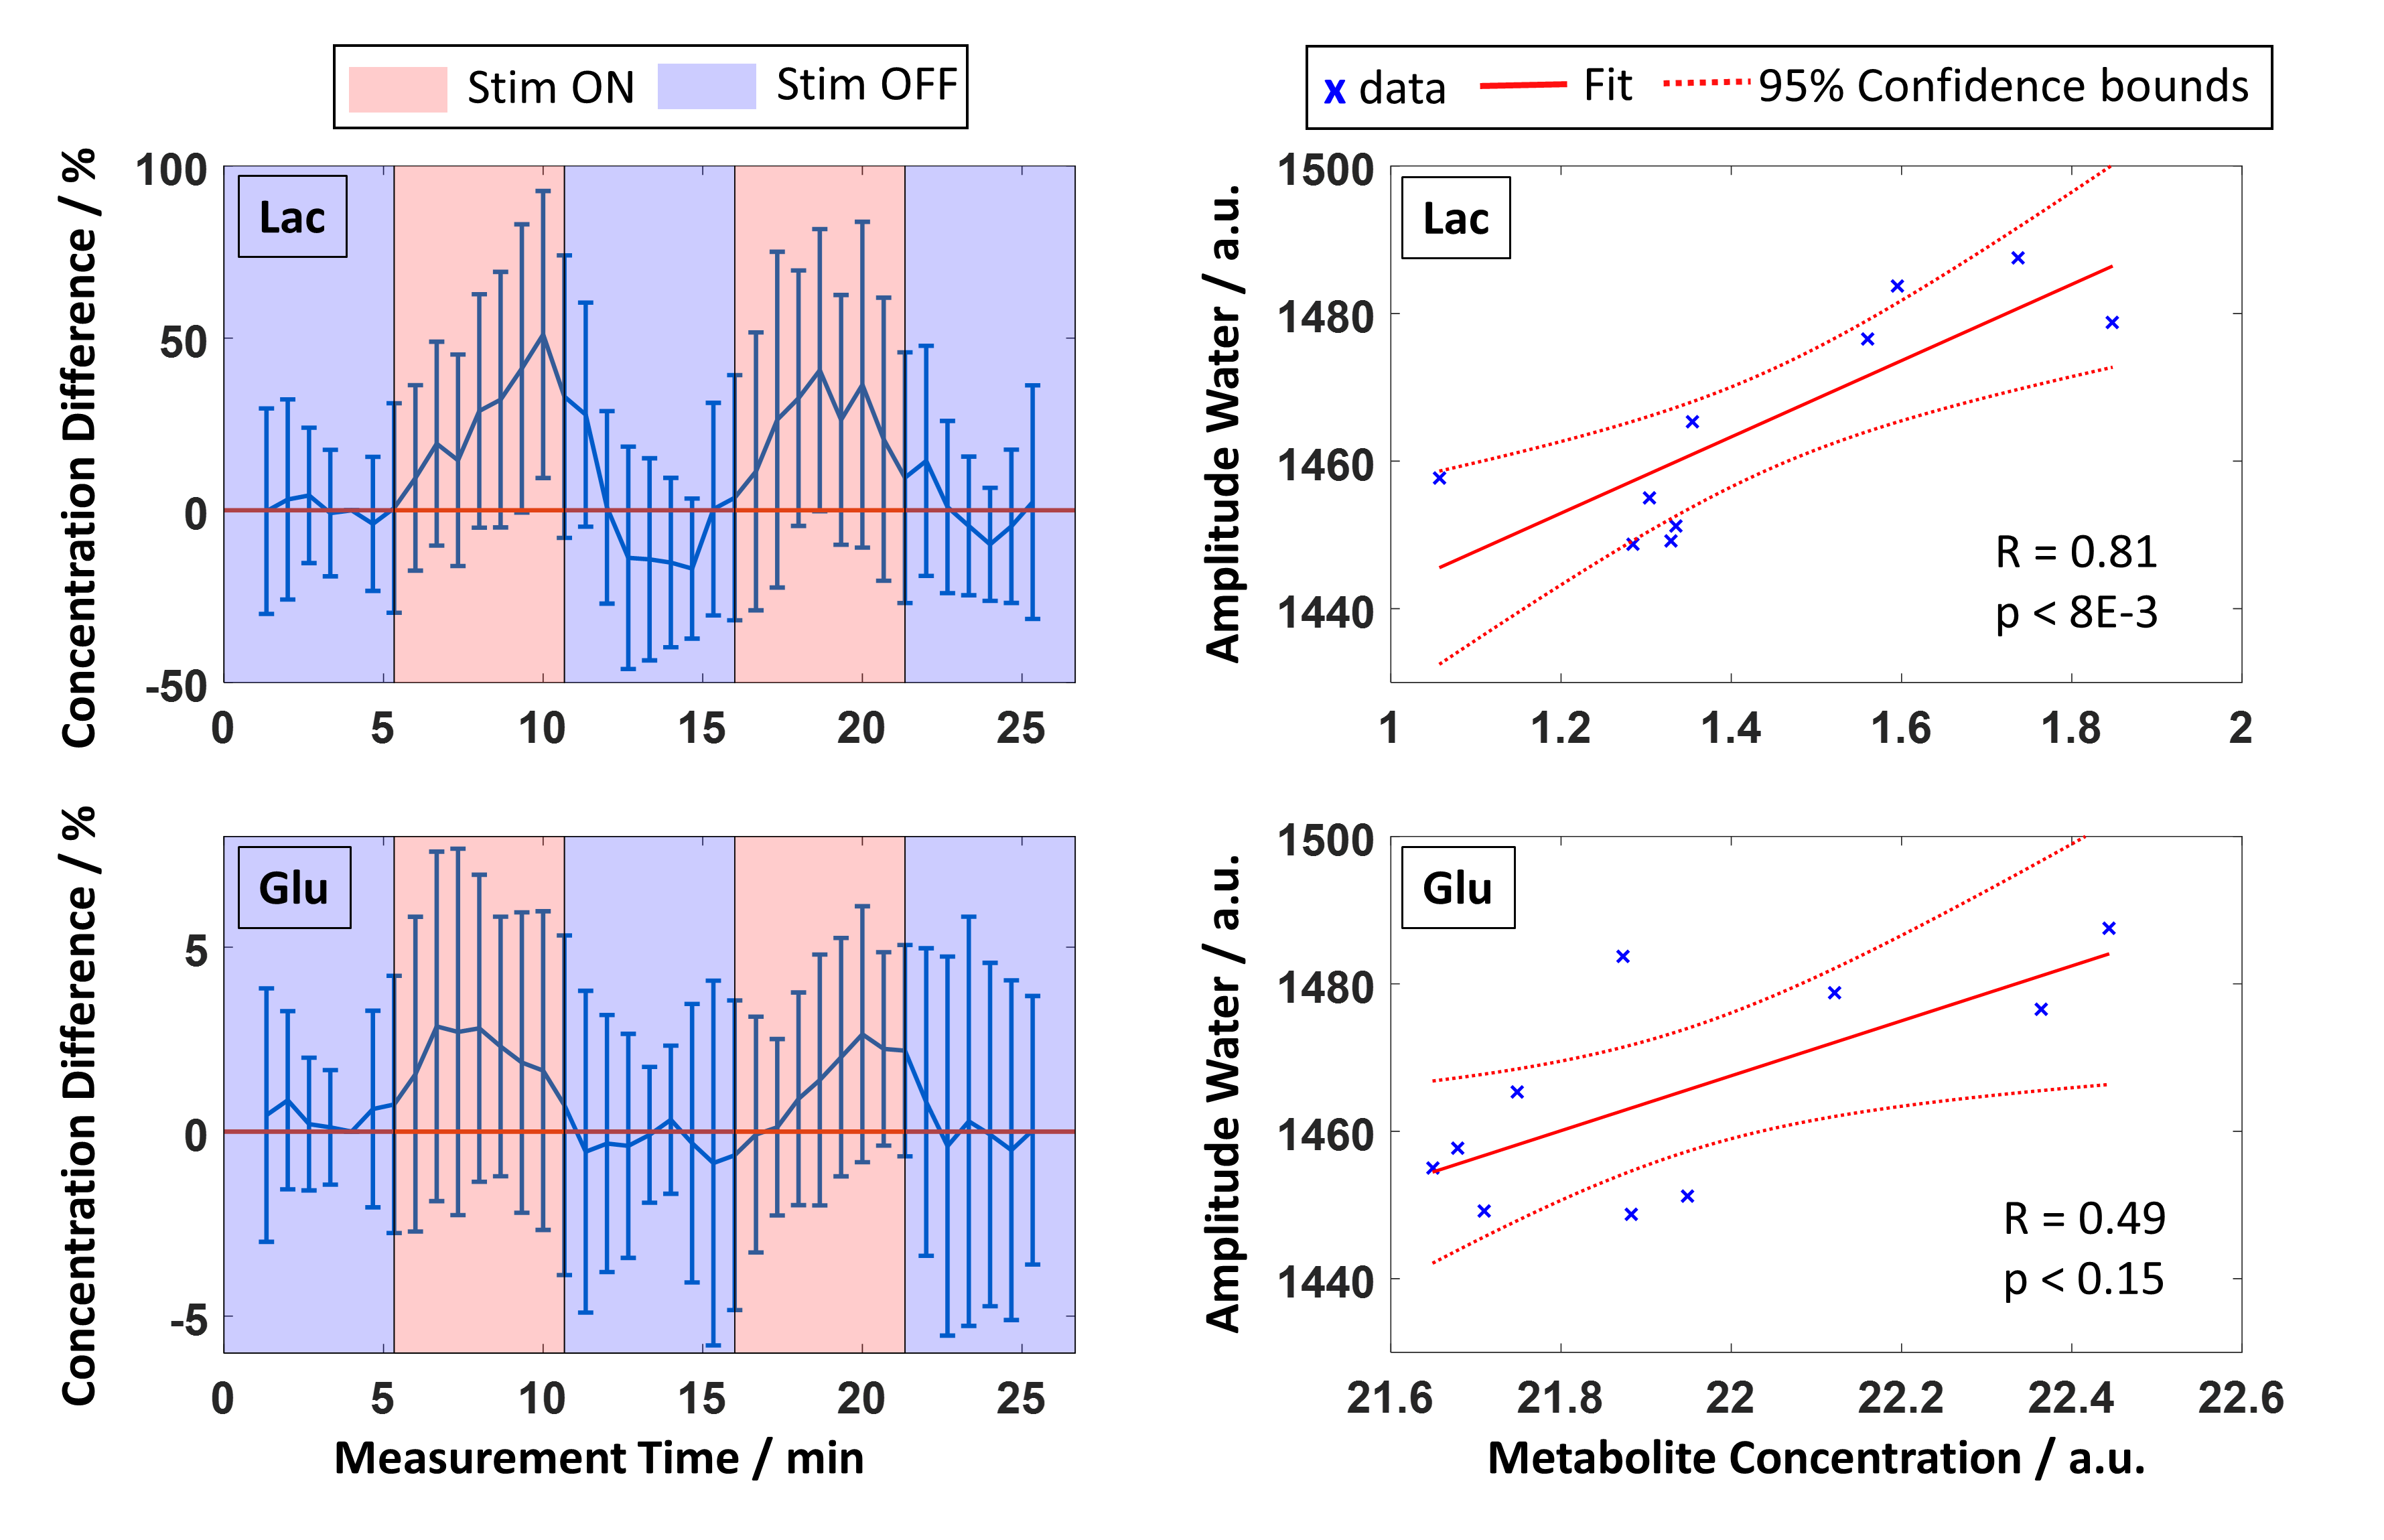
Figure 4: Left: Mean time courses of Lac and Glu concentration differences relative to a baseline concentration (R1.2) with a time resolution of 40 s. Error bars represent standard deviations of the mean over all volunteers.
Right: Correlation plots between the metabolite concentrations (from spectra summed across all volunteers) and the MC water amplitude (blue crosses). Solid red lines represent the linear fit, dotted red lines 95% confidence intervals. R and p values indicate the Spearman’s Rank Correlation Coefficient and significance level of the correlation, respectively.