Claudius Sebastian Mathy1,2,3, Monique A. Thomas1, Graeme F. Mason1,4,5, Robin A. de Graaf1,5, and Henk M. De Feyter1
1Department of Radiology and Biomedical Imaging, Magnetic Resonance Research Center, Yale University, New Haven, CT, United States, 2Institute of Physical and Theoretical Chemistry, University of Bonn, Bonn, Germany, 3Department of Diagnostic and Interventional Radiology, RWTH Aachen, Aachen, Germany, 4Department of Psychiatry, Yale University, New Haven, CT, United States, 5Department of Biomedical Engineering, Yale University, New Haven, CT, United States
1Department of Radiology and Biomedical Imaging, Magnetic Resonance Research Center, Yale University, New Haven, CT, United States, 2Institute of Physical and Theoretical Chemistry, University of Bonn, Bonn, Germany, 3Department of Diagnostic and Interventional Radiology, RWTH Aachen, Aachen, Germany, 4Department of Psychiatry, Yale University, New Haven, CT, United States, 5Department of Biomedical Engineering, Yale University, New Haven, CT, United States
Dynamic,
spatially localized DMI data, and proton-observed carbon-edited (POCE) MRS data were
acquired during infusion of [6,6’-2H2]-glucose and [1-13C]-glucose.
A metabolic model incorporating 2H-label loss provided metabolic
flux rates that agreed with those based on POCE MRS.
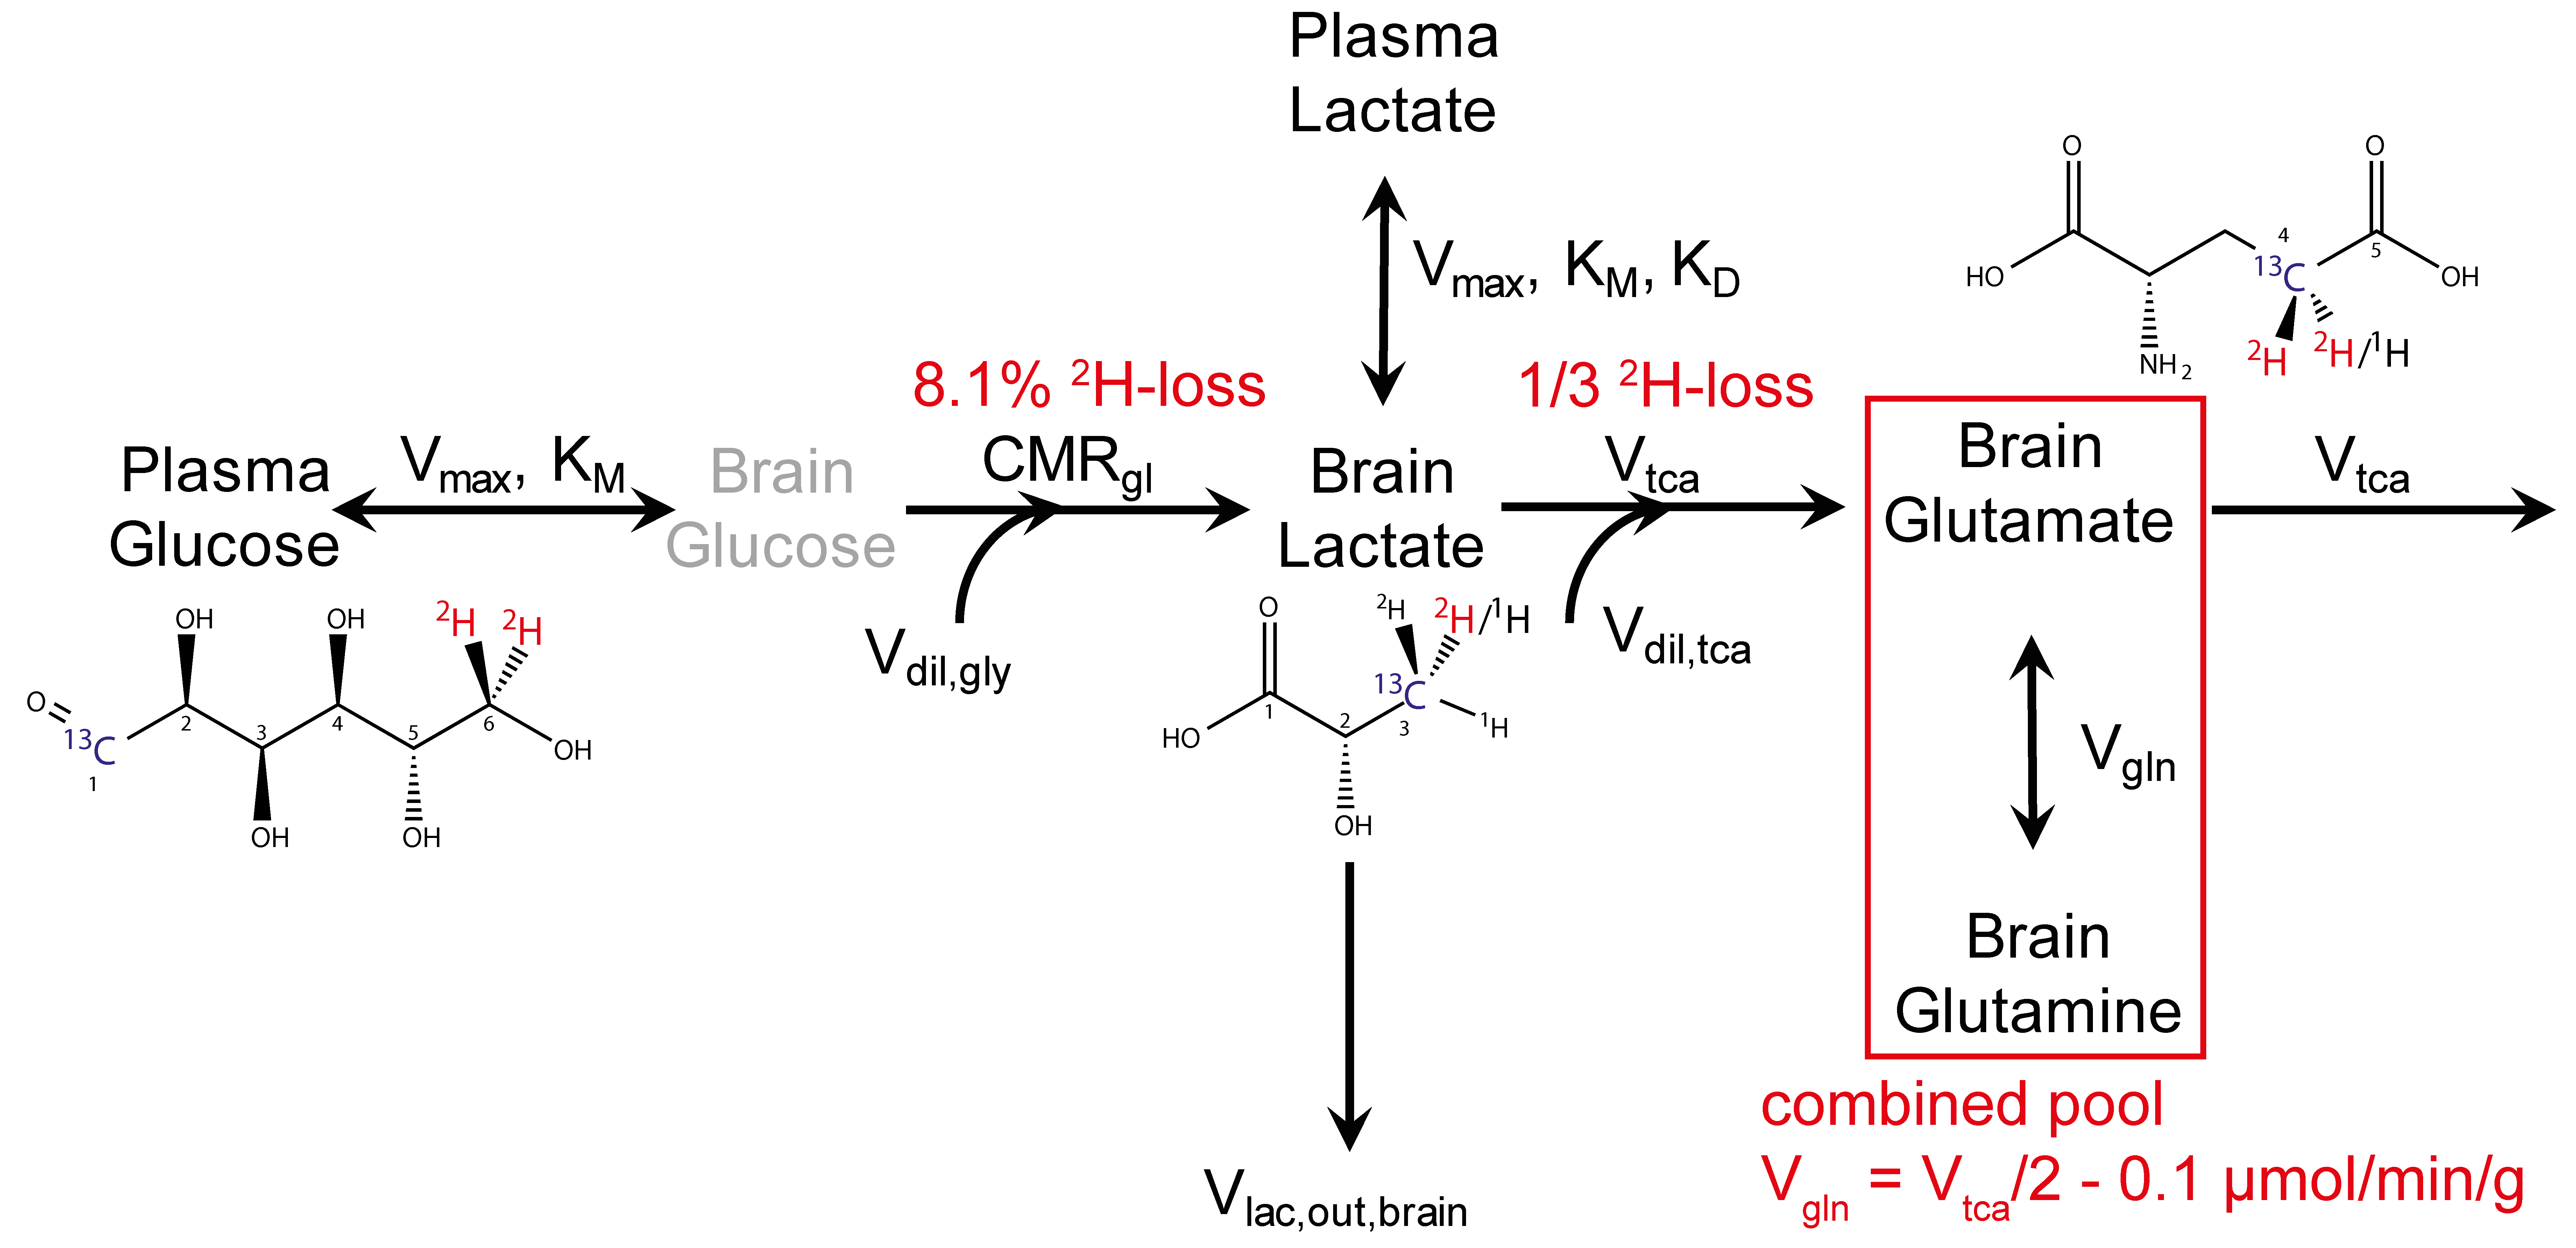
Fig. 1:
Metabolic model: Glucose is
transported through the blood-brain barrier by GLUT-1 transporters and metabolized
to pyruvate/lactate by CMRgl. Lactate also enters via monocarboxylic
acid transporters, characterized by Vmax, KM and KD.
Lactate/pyruvate is further metabolized in the TCA cycle (Vtca).
Unlabeled substrate in- and outflows are Vdil,gly = Vlac,out,brain
and Vdil,tca. The glutamate/glutamine cycle is represented by Vgln.
Modifications for 2H are indicated in red. 13C and 2H
label positions are shown.
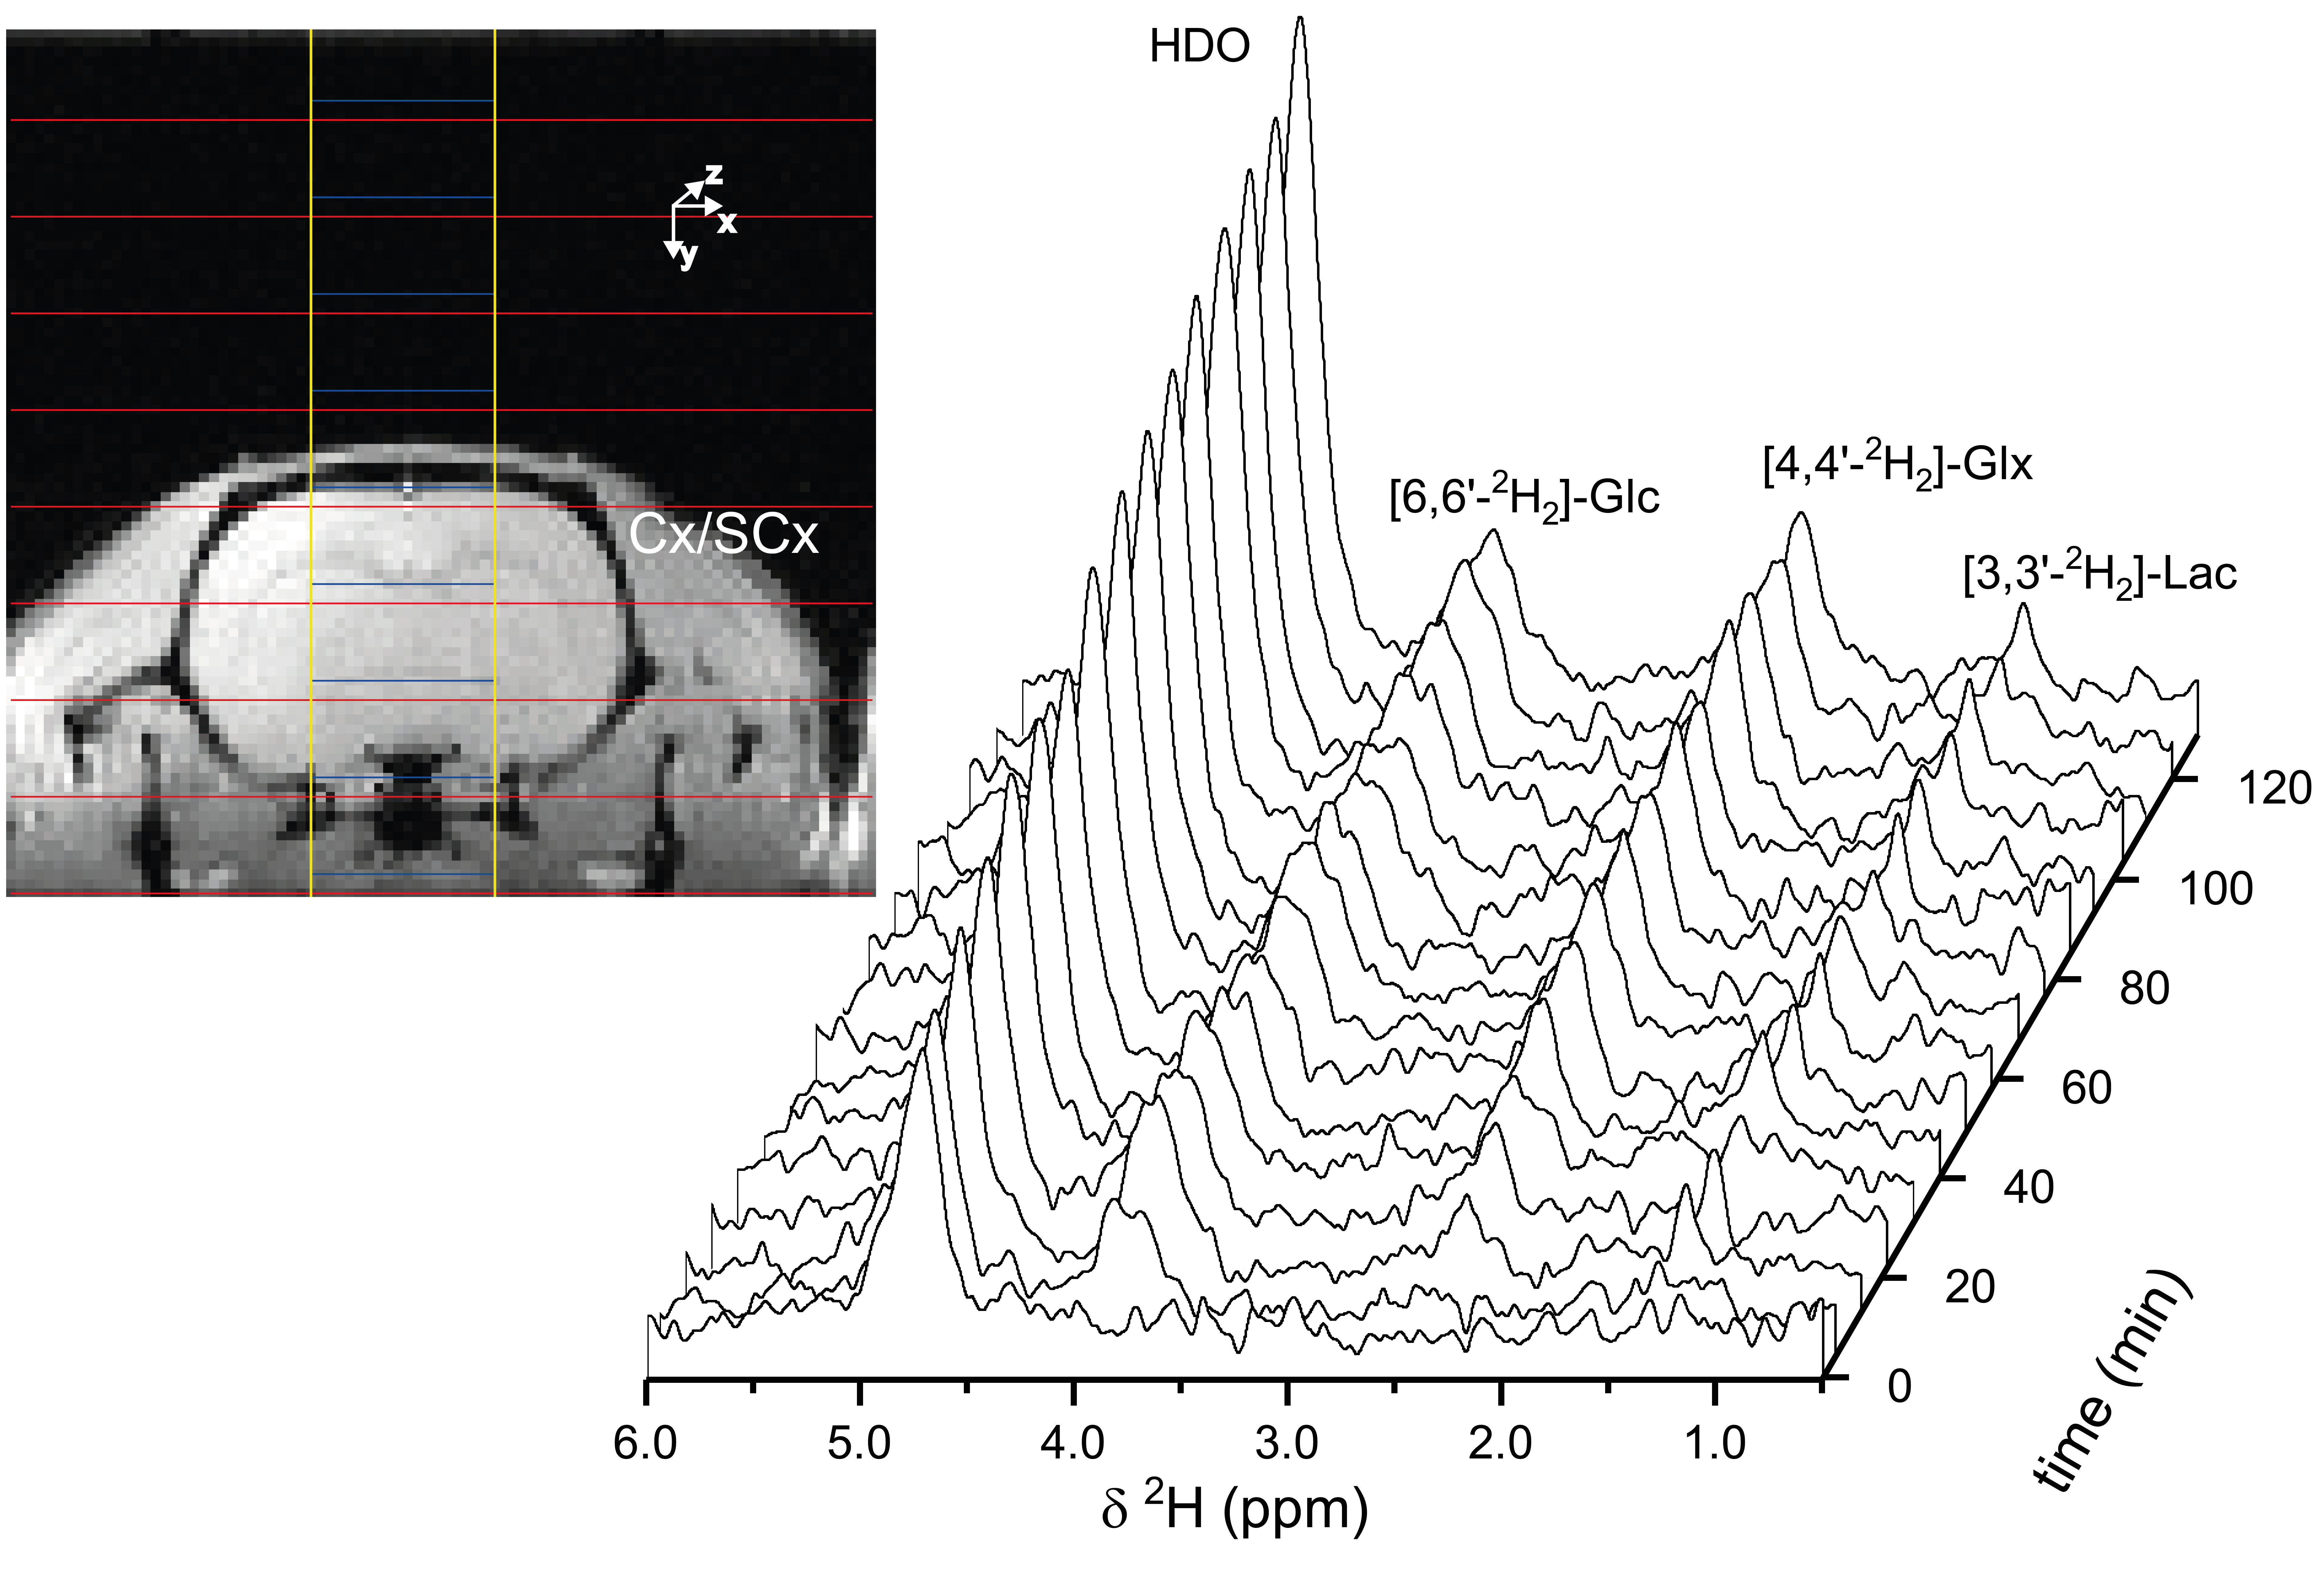
Fig. 3: Axial MR image for spatial
assignment. Time course of 2H MR spectra during [6,6’-2H2]-glucose
infusion, starting from baseline prior to infusion until the end of the
experiment with n=64 averages each, acquired from combined cortex/subcortex (Cx/SCx) volume. Line
broadening=2Hz. Labeled metabolites are marked as double labeled but the
signals include both single and double 2H-labeled metabolites.