Abigail T.J. Cember1, Laurie J. Rich1, Puneet Bagga1, Neil E. Wilson2, Ravi Prakash Reddy Nanga1, Deepa Thakuri1, Mark Elliott1, Mitchell D. Schnall3, John A. Detre4, and Ravinder Reddy1
1Center for Magnetic Resonance and Optical Imaging, Department of Radiology, University of Pennsylvania, Philadelphia, PA, United States, 2Siemens Medical Solutions, USA, Malvern, PA, United States, 3Department of Radiology, University of Pennsylvania, Philadelphia, PA, United States, 4Department of Neurology, University of Pennsylvania, Philadelphia, PA, United States
1Center for Magnetic Resonance and Optical Imaging, Department of Radiology, University of Pennsylvania, Philadelphia, PA, United States, 2Siemens Medical Solutions, USA, Malvern, PA, United States, 3Department of Radiology, University of Pennsylvania, Philadelphia, PA, United States, 4Department of Neurology, University of Pennsylvania, Philadelphia, PA, United States
Using only 1H MRS at 7T, we present dynamic mapping of neurometabolism downstream of glucose absorption. Specifically, we focus on the possibility of measuring glutamate turnover in a spatially resolved fashion using chemical shift imaging in which the signal is modulated by labeling with 2H.
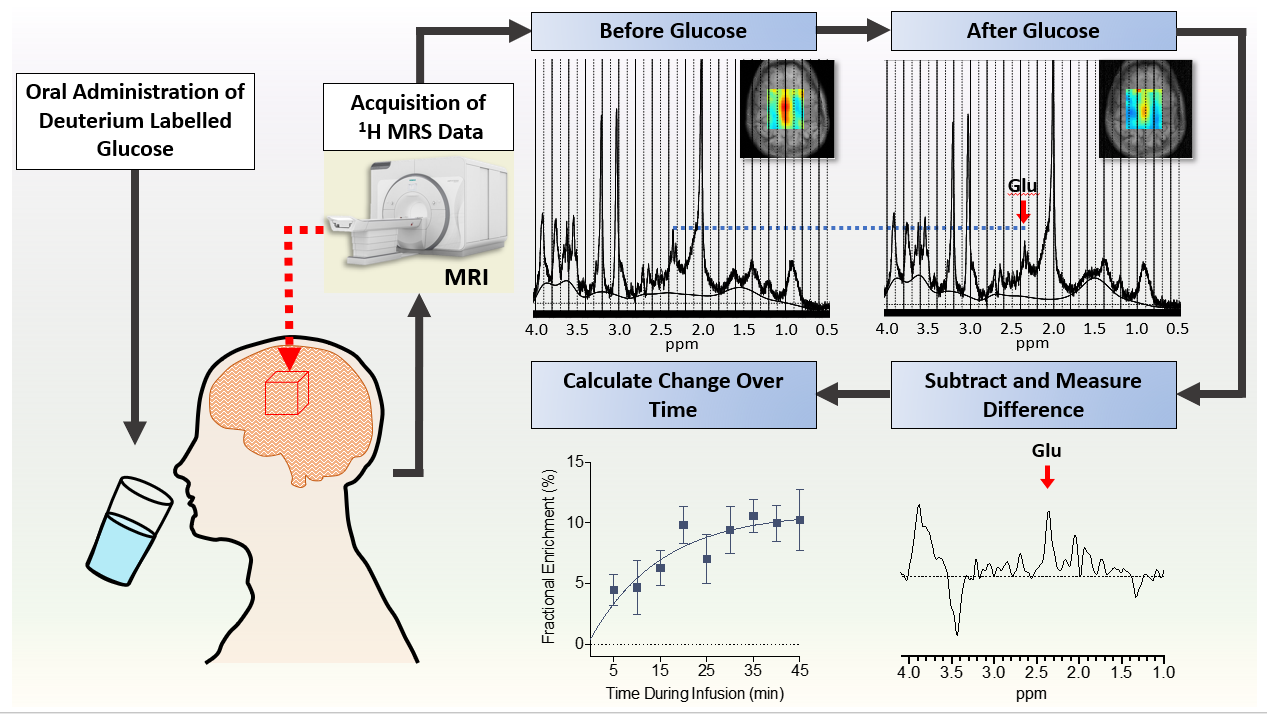
Figure 1. Schematic of qMRS experiment. Subject drinks
aqueous deuterated glucose solution. Prior to this, subject has undergone MR spectroscopy
and chemical shift imaging (qCSI) at 7T. After glucose ingestion, subject is
scanned again. In this post-glucose scan, 1H resonances of metabolites
experiencing labeling downstream from glucose will decrease. qCSI measurements
are made repeatedly and, as labelled glucose is absorbed from the bloodstream
and metabolized, the fractional enrichment of detected metabolites increases
and eventually plateaus.
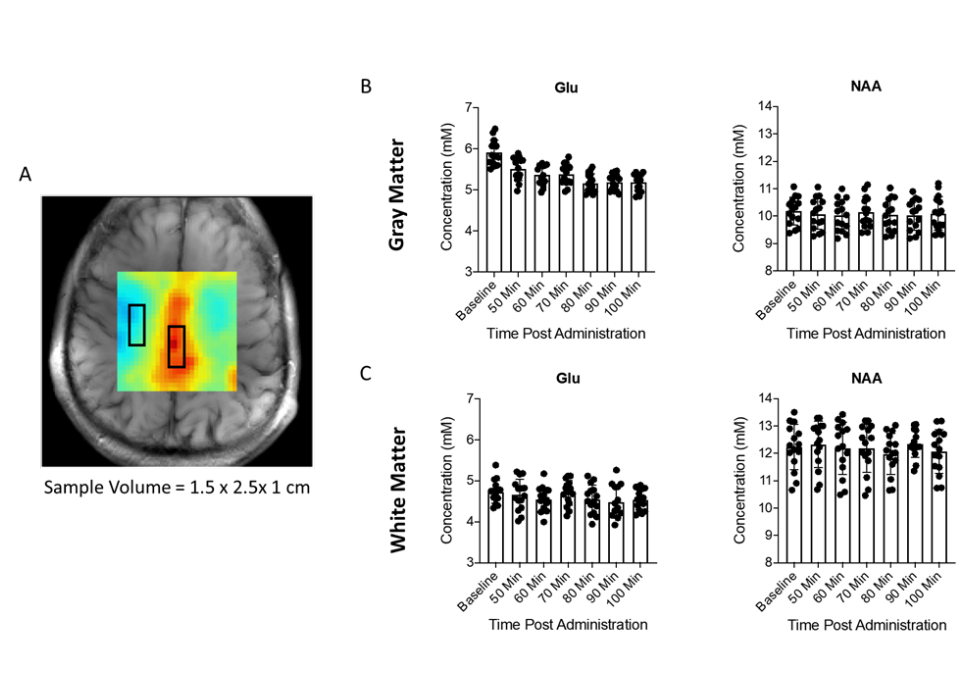
Figure 3. Timecourse qCSI data of [Glu] and [NAA] from all
subjects, gray and white matter.
A) Glu/NAA ratio map (MRSI) illustrating ROIs
used for calculation of the plotted data designated as gray and white matter
regions. B) Bar graphs showing the timecourse measurements of Glu and NAA by
qCSI in gray and white matter. In this plot, individual dots correspond to a
single voxel (out of 15) in each ROI, averaged across four subjects who
underwent this part of the experiment.