Chenying Zhao1,2, Gabriel Santpere3, Minhui Ouyang1, David Andrijevic4, Nenad Sestan4, and Hao Huang1,5
1Department of Radiology, Children's Hospital of Philadelphia, Philadelphia, PA, United States, 2Department of Bioengineering, School of Engineering and Applied Science, University of Pennsylvania, Philadelphia, PA, United States, 3Neurogenomics group, Research Programme on Biomedical Informatics (GRIB), Hospital del Mar Medical Research Institute (IMIM), DCEXS, Universitat Pompeu Fabra, Barcelona, Spain, 4Department of Neuroscience and Kavli Institute for Neuroscience, Yale School of Medicine, New Haven, CT, United States, 5Department of Radiology, Perelman School of Medicine, University of Pennsylvania, Philadelphia, PA, United States
1Department of Radiology, Children's Hospital of Philadelphia, Philadelphia, PA, United States, 2Department of Bioengineering, School of Engineering and Applied Science, University of Pennsylvania, Philadelphia, PA, United States, 3Neurogenomics group, Research Programme on Biomedical Informatics (GRIB), Hospital del Mar Medical Research Institute (IMIM), DCEXS, Universitat Pompeu Fabra, Barcelona, Spain, 4Department of Neuroscience and Kavli Institute for Neuroscience, Yale School of Medicine, New Haven, CT, United States, 5Department of Radiology, Perelman School of Medicine, University of Pennsylvania, Philadelphia, PA, United States
Dynamic
transcriptomic basis of structural connectome was studied by associating spatiotemporal
transcriptome map from over 10,000 genes and diffusion-MRI-derived structural network
through the 3rd trimester and early childhood.
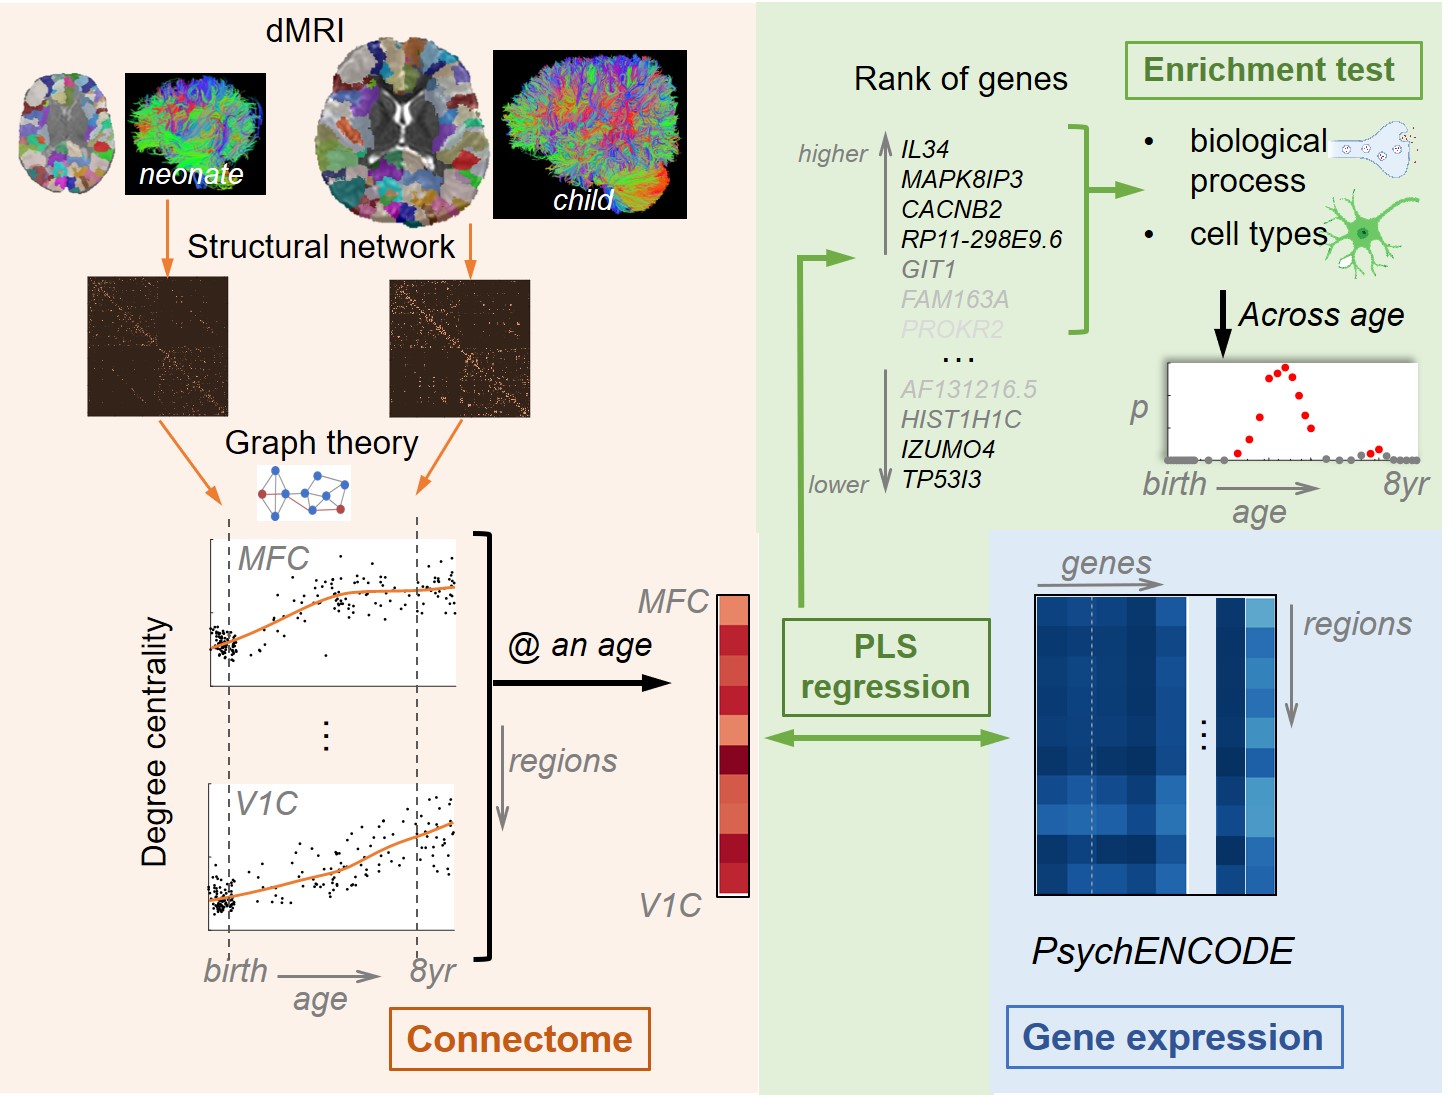
Figure 1. The
schematic pipeline of construction of connectome trajectory (in pink) and its
association (in green) with gene expression (in blue) from the 3rd
trimester to 8 years of age. Abbreviations: PLS = partial least squares; MFC =
medial prefrontal cortex; V1C = primary visual cortex.
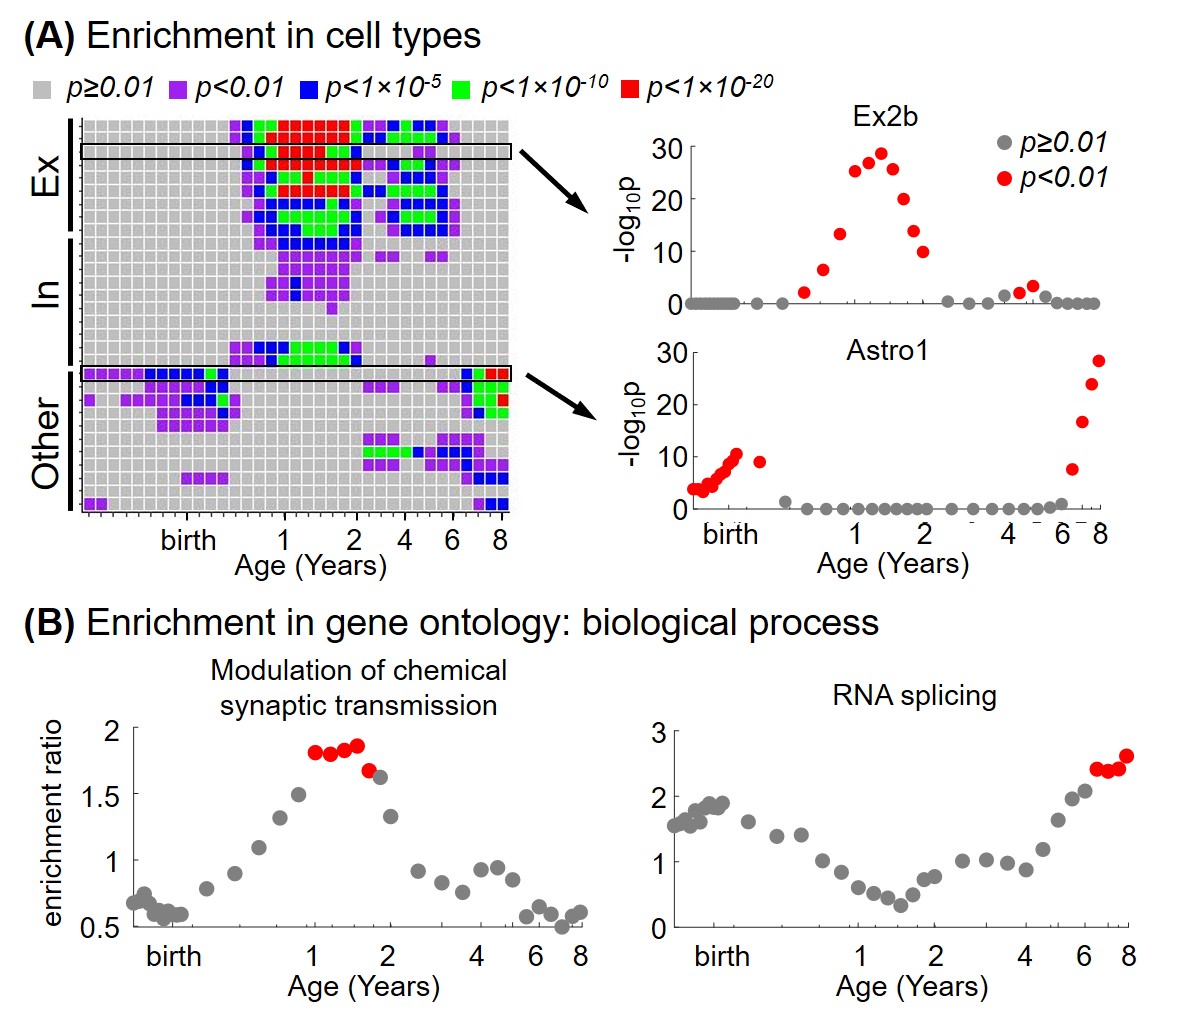
Figure 4. Gene
enrichment analysis in top 10% genes associated with degree centrality
demonstrated dynamic enrichment in (A) different cell types and (B) gene
ontology terms for biological process through the 3rd trimester and early childhood. Significance is labeled by color (red dot: p<0.05; gray
dot: p≥0.05, FDR corrected). Abbreviations: Ex=excitatory; In=inhibitory
neuron; Other=other types of cells in brain. Ex2b and Astro1 are subtypes of
excitatory neuron and astrocyte, respectively.