Paul S Jacobs1 and Andrew J Fagan1
1Radiology, Mayo Clinic, Rochester, MN, United States
1Radiology, Mayo Clinic, Rochester, MN, United States
Maximum 1g-averaged SAR values adjacent to orthopedic screws or varying lengths from 3T to 7T were simulated, with a 36% reduction in SARmax found at 7T compared to a peak near 4T.
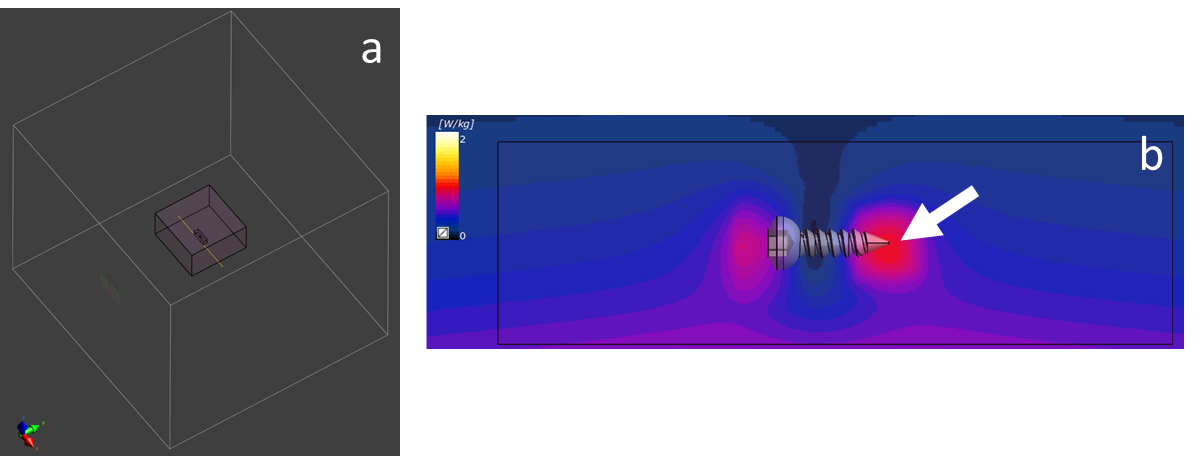
Figure 2. (a)
A schematic from the simulation environment showing the overall simulation
volume (white box), the tissue volume (purple), the dipole antenna (yellow),
and the high mesh density volume around the screw (dark purple). (b) Representative example of a SAR map,
showing the location where the SARmax value was typically located at
the screw tip (arrow).
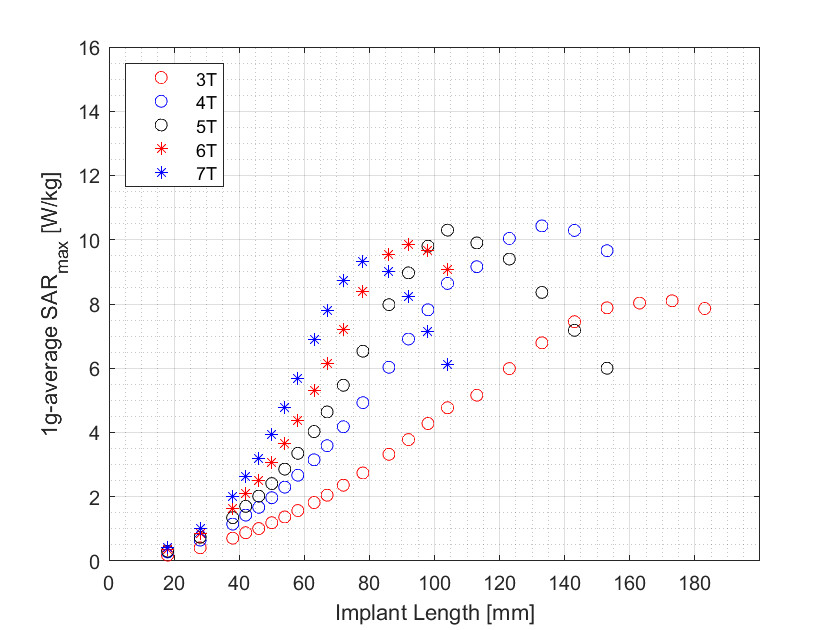
Figure 3. Graph
of the SARmax for each field strength configuration as a function of
implant length embedded in bone tissue. The simulated input RF power levels
were normalized to ensure the same transmitted power of 1W by the dipole
antennas across all field strengths.