Jeremy W Gordon1, Hsin-Yu Chen1, Philip Lee1, Robert Bok1, Michael Ohliger1, Andrew Ko2, Eric Collisson2, Margaret Tempero2, Pelin Cinar2, Peder Larson1,3, and Zhen Jane Wang1,3
1Department of Radiology & Biomedical Imaging, University of California, San Francisco, San Francisco, CA, United States, 2Department of Medicine, University of California, San Francisco, San Francisco, CA, United States, 3UC Berkeley-UCSF Graduate Program in Bioengineering, San Francisco, CA, United States
1Department of Radiology & Biomedical Imaging, University of California, San Francisco, San Francisco, CA, United States, 2Department of Medicine, University of California, San Francisco, San Francisco, CA, United States, 3UC Berkeley-UCSF Graduate Program in Bioengineering, San Francisco, CA, United States
Higher lactate/pyruvate and lower alanine/pyruvate ratios were seen in the tumors of patients with pancreatic ductal adenocarcinoma. The alanine/lactate ratio, which reflects the relative enzymatic activity and metabolite pool sizes, was reduced 2- to 20-fold in the tumors.
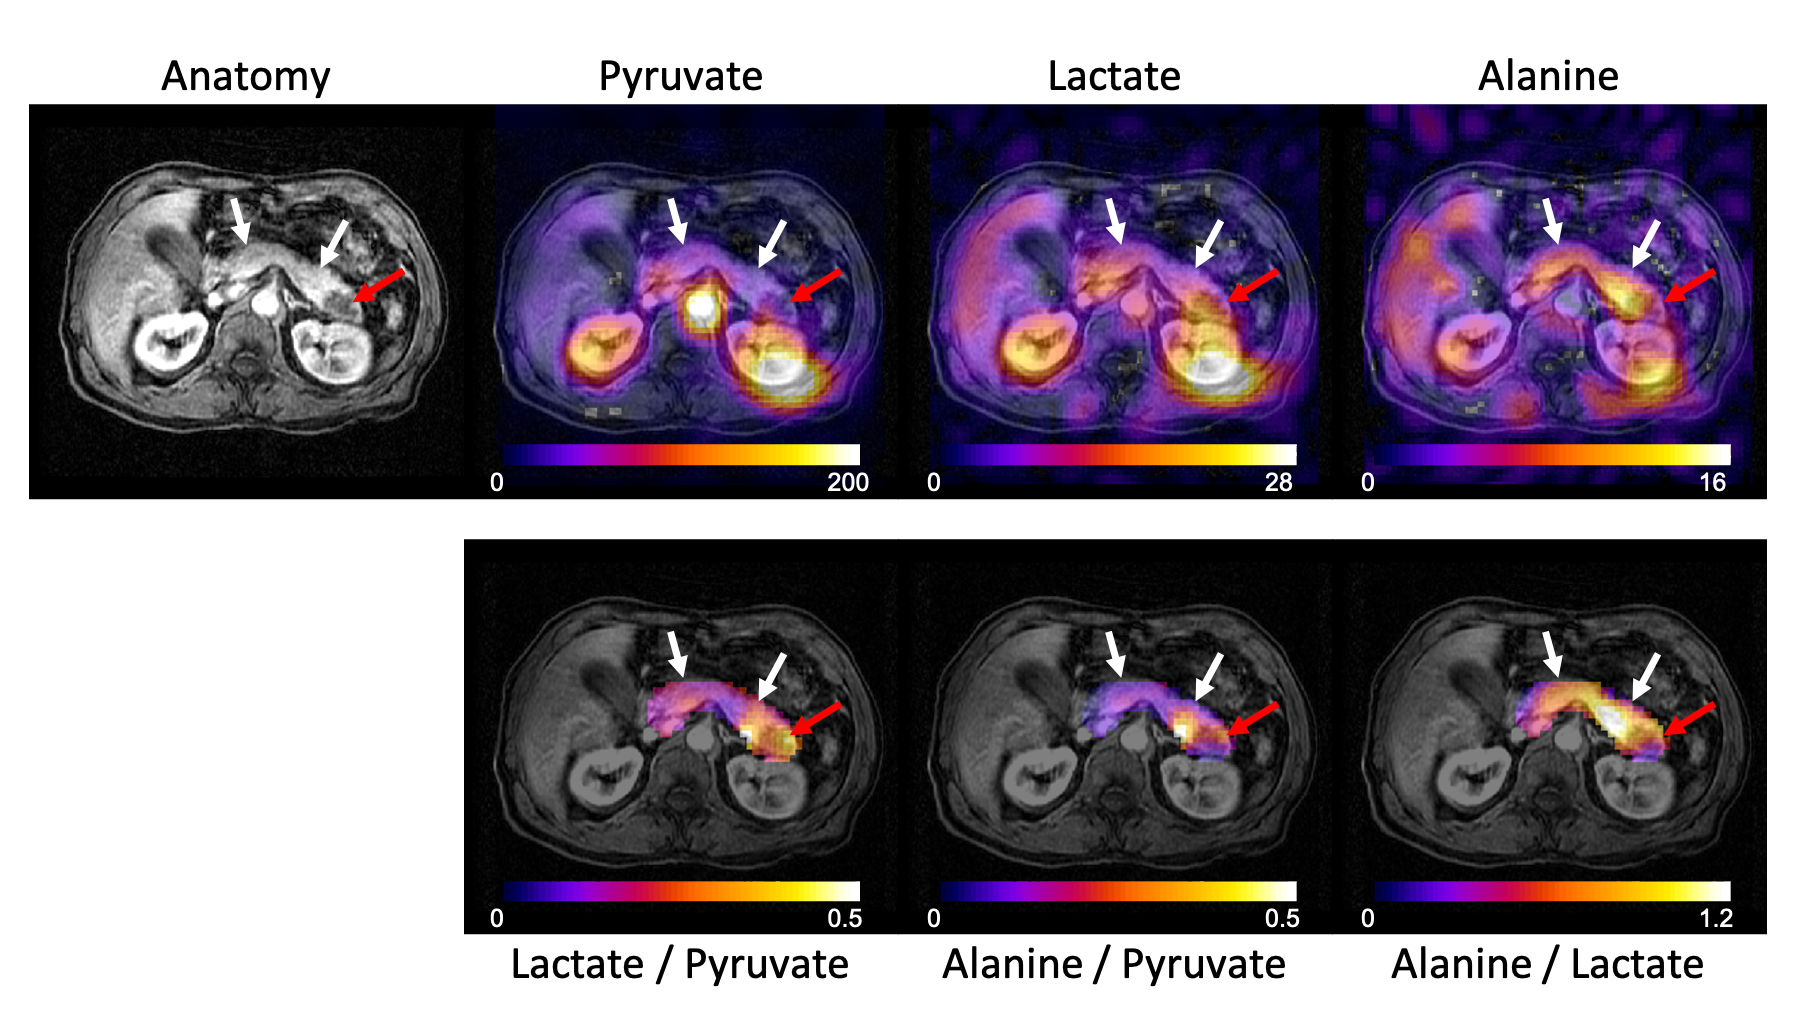
Figure 1. Representative hyperpolarized 13C data from a patient with pancreatic ductal adenocarcinoma in the tail of the pancreas. The top row shows the metabolite AUC (area under the curve) for pyruvate and downstream metabolites. Normalizing to pyruvate removes signal variation from perfusion and coil shading, providing quantitative information on conversion to lactate and alanine (bottom row). The alanine/lactate ratio provides a relative measure of metabolism and was ~2-fold lower (0.46 vs 0.79) in the tumor (red arrow) than in the normal appearing pancreas (white arrows).
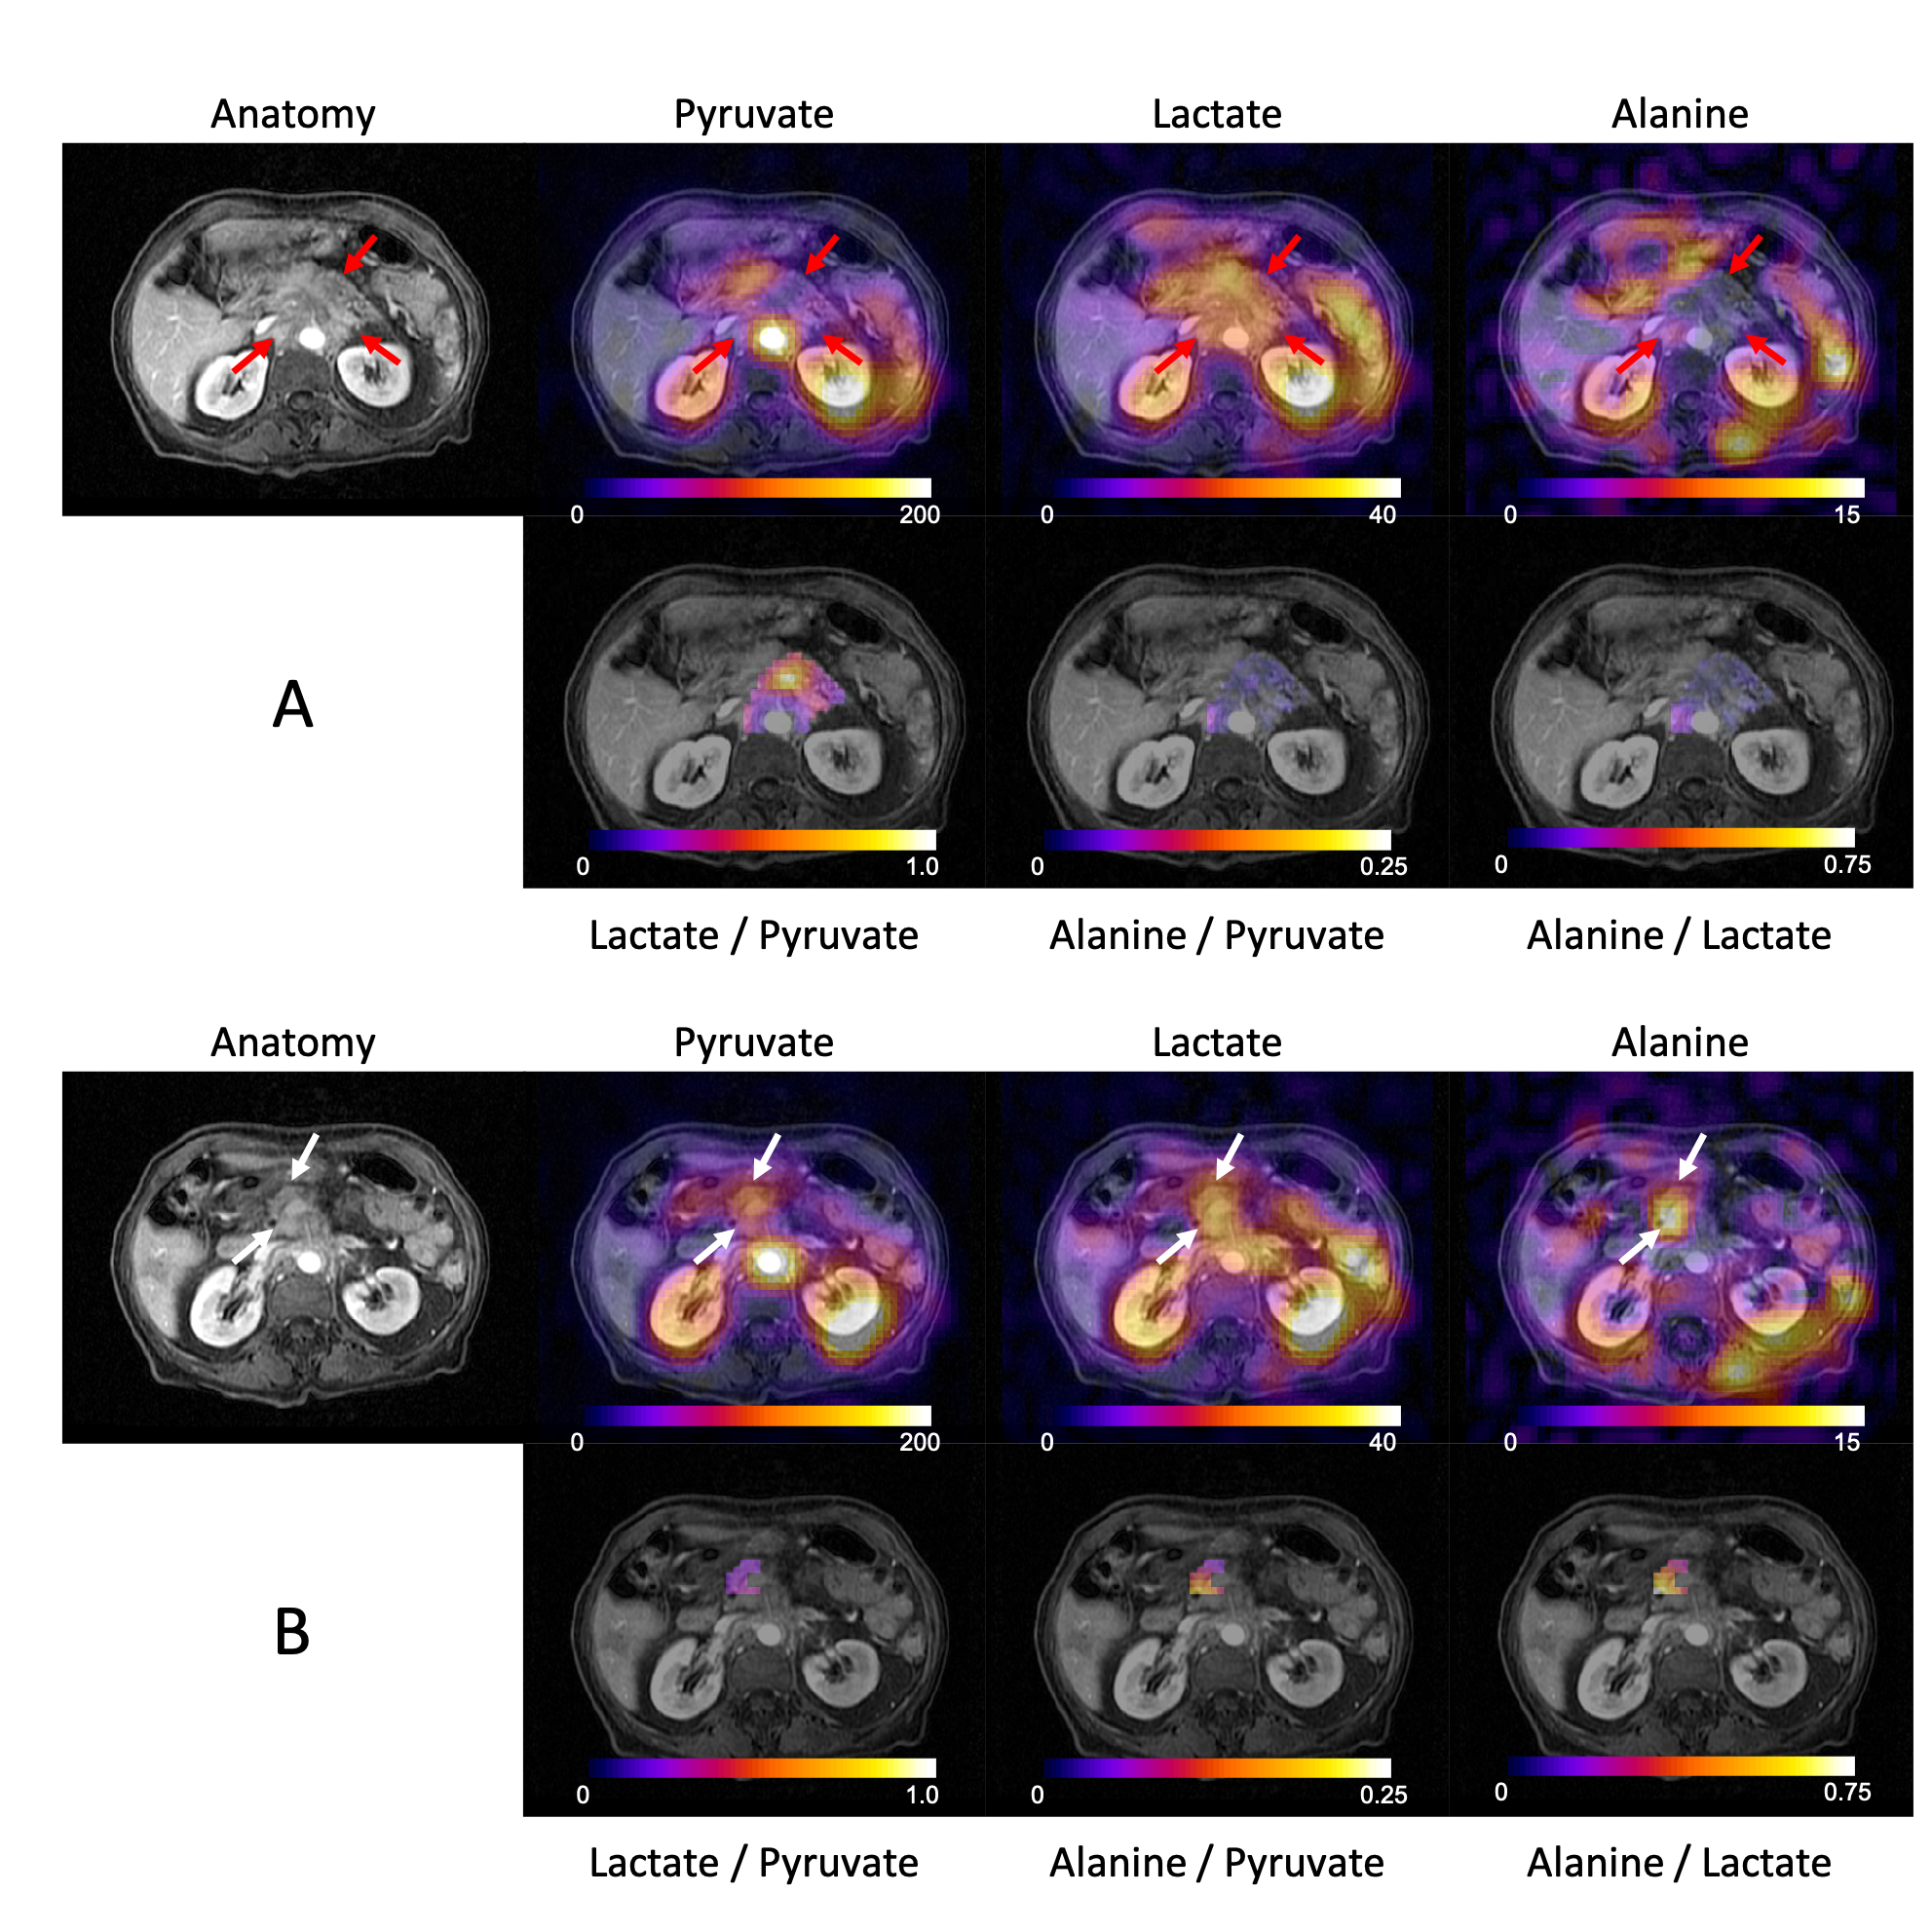
Figure 2. Metabolic 13C data from two slices in a patient with pancreatic ductal adenocarcinoma in the body of the pancreas, with extension into the retroperitoneum. Higher lactate/pyruvate and lower alanine/pyruvate was observed in the tumor slice (A, red arrows), while the opposite was seen in the normal appearing pancreas slice (B, white arrows). The alanine/lactate ratio provides a relative measure of metabolism and was 21-fold lower (0.02 vs 0.42) in the tumor than in the normal appearing pancreas.