Di Cao1,2, Ningdong Kang1, Jay J. Pillai1, Xinyuan Miao1,2, Adrian Paez2, Xiang Xu1,2, Jiadi Xu1,2, Xu Li1,2, Qin Qin1,2, Peter C.M. Van Zijl1,2, Peter Barker1, and Jun Hua1,2
1Johns Hopkins University, Baltimore, MD, United States, 2Kennedy Krieger Institute, Baltimore, MD, United States
1Johns Hopkins University, Baltimore, MD, United States, 2Kennedy Krieger Institute, Baltimore, MD, United States
We demonstrate a 3D-TSE sequence for the detection of Gd induced MR signal changes in the CSF with a sub-millimeter spatial resolution, a temporal resolution of <10s and whole-brain coverage.
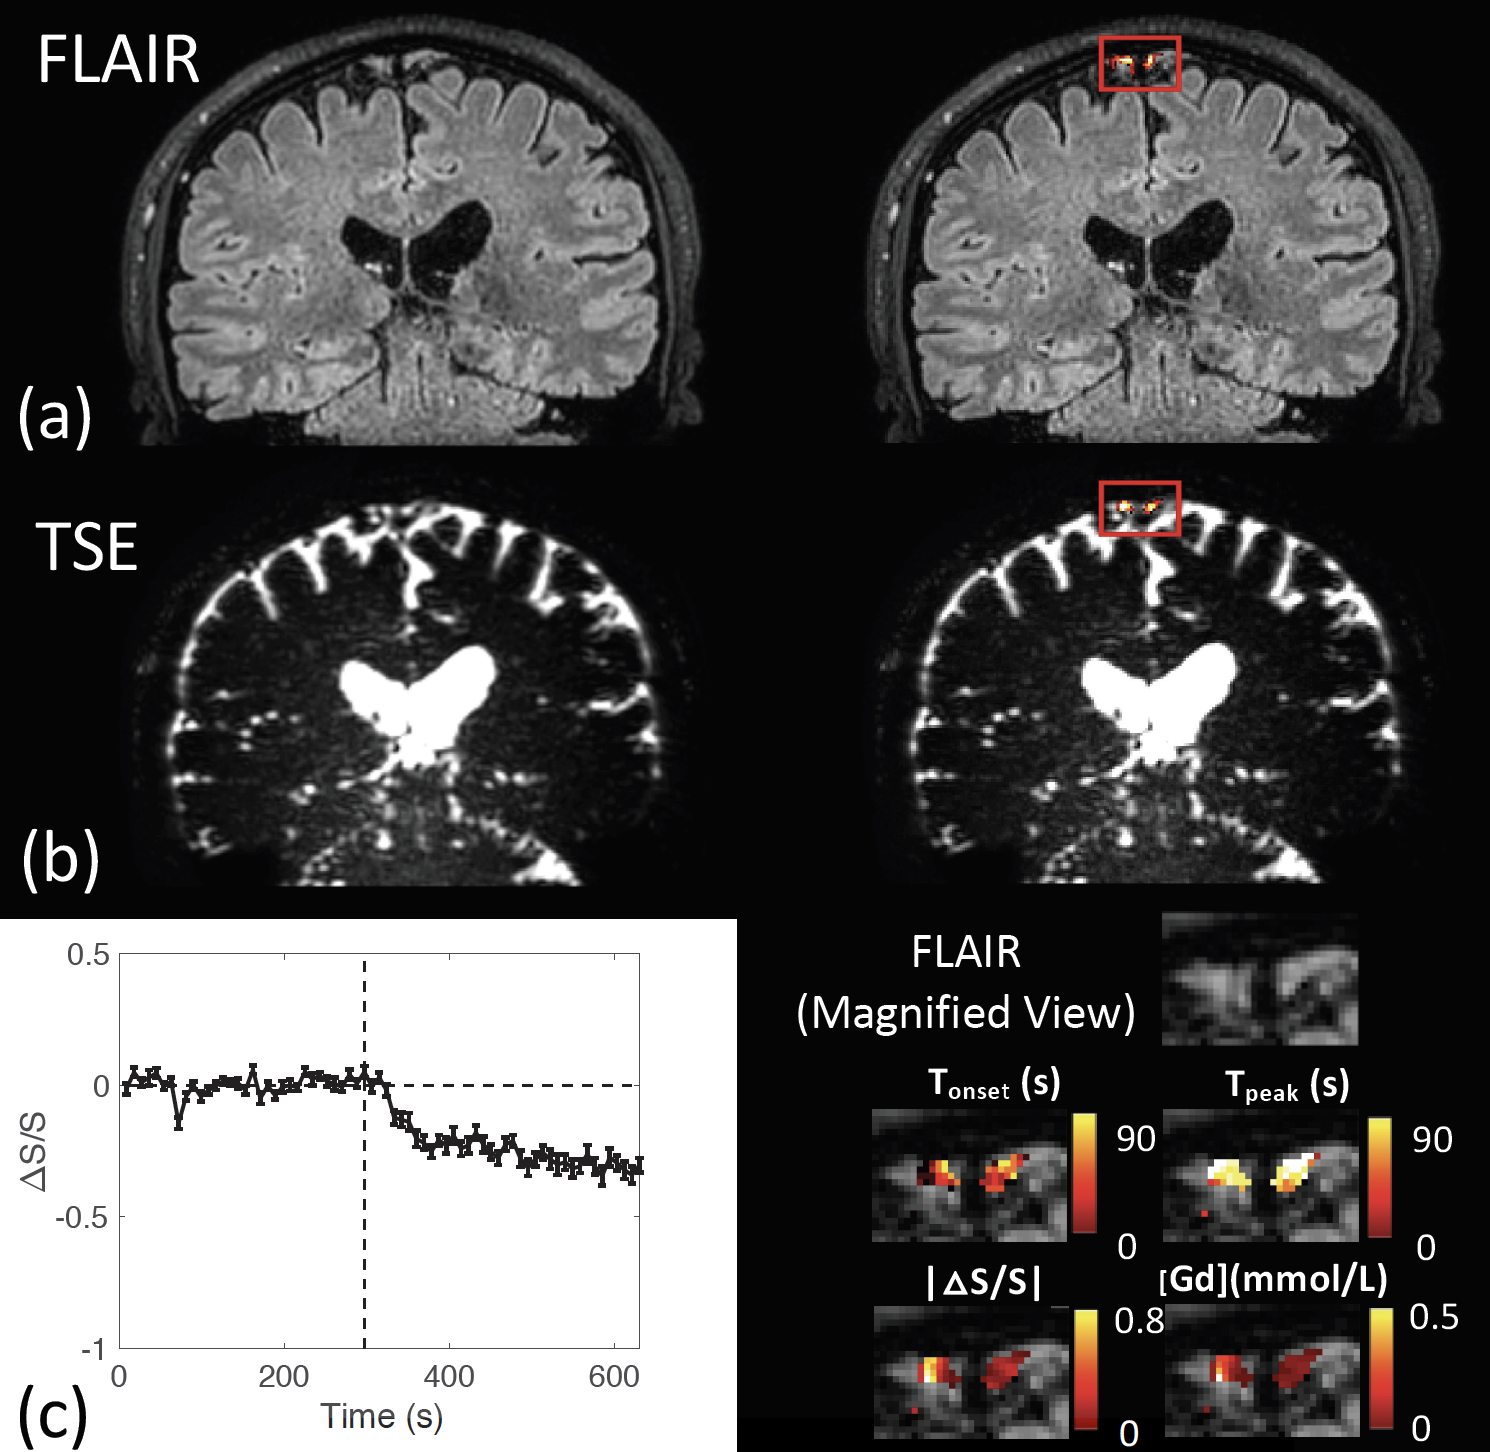
Figure 4. Typical results from human scans on 3T from regions around the dural sinuses (DS) where lymphatic vessels were identified in previous studies. (a) FLAIR overlaid with ΔS/S from the ROI; (b) The proposed 3D TSE image overlaid with ΔS/S; (c) Average time course from 3D TSE from the ROI, and four parametric maps extracted from the time course: onset time (Tonset), time to peak (Tpeak), |ΔS/S|, and [Gd]. The vertical dashed line indicates the time when Gd is injected.
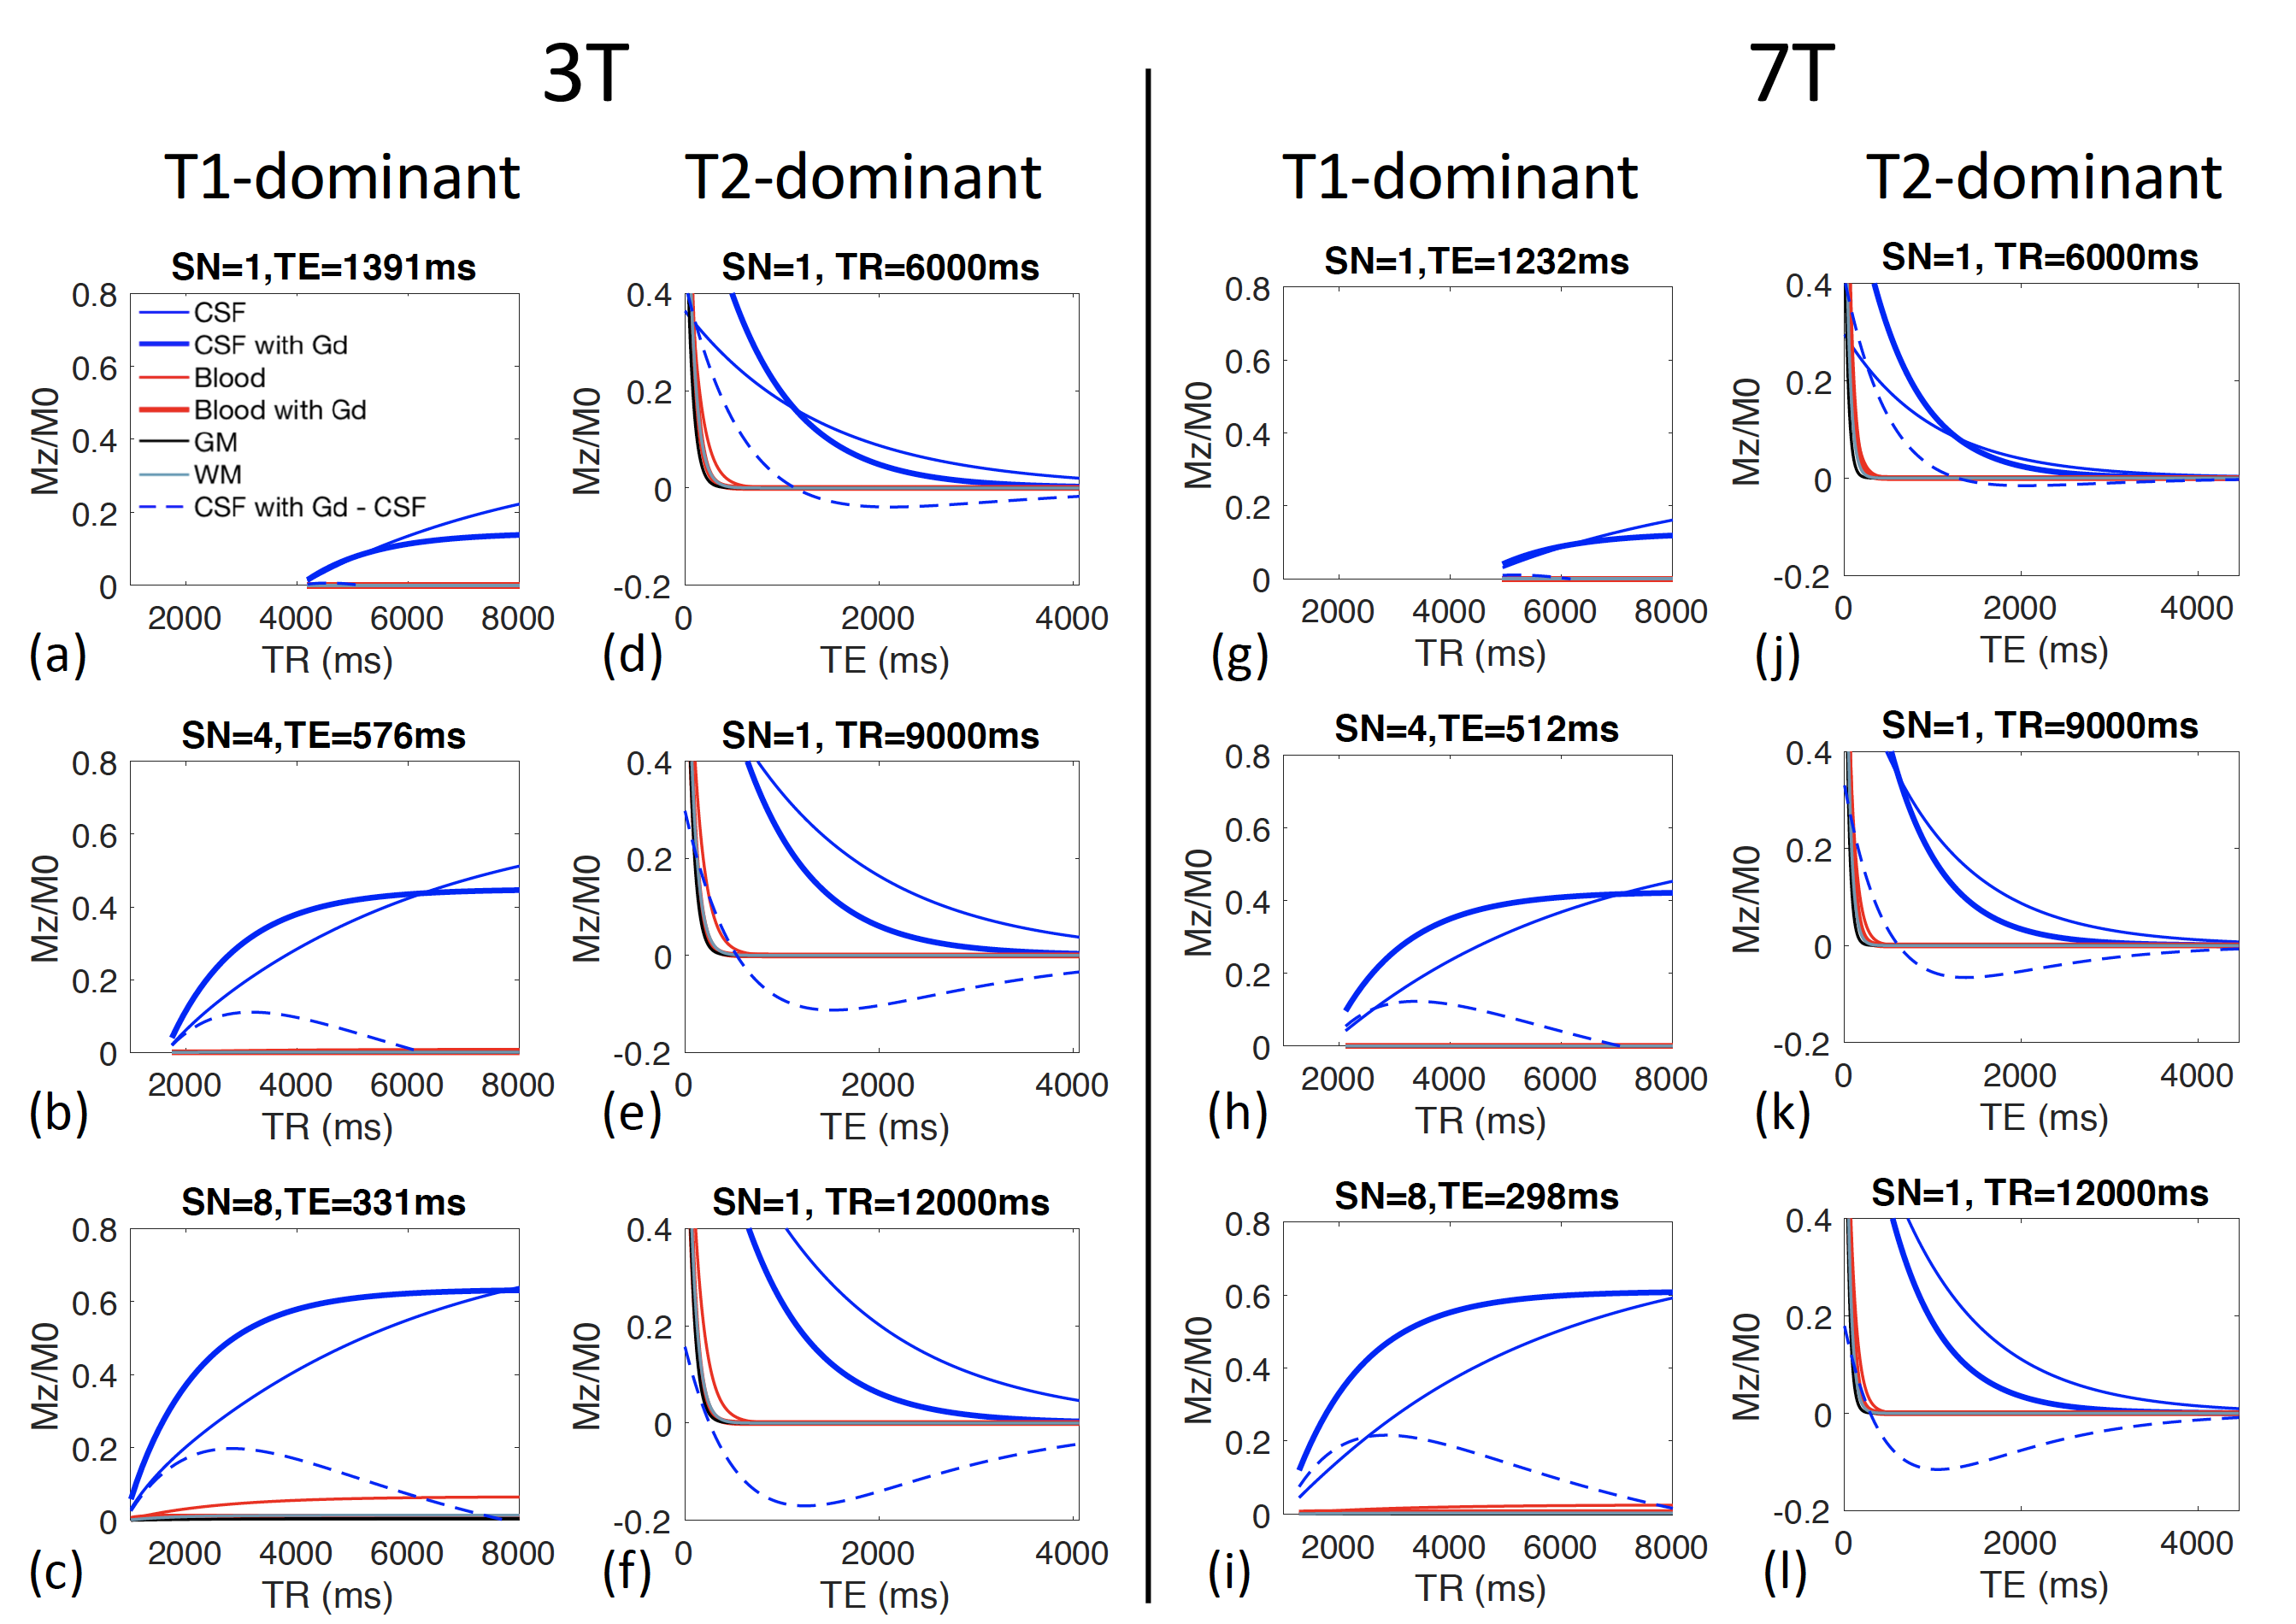
Figure 1. Simulation results for the proposed 3D TSE sequences: (a-c) 3T, T1-dominant; (d-f) 3T, T2-dominant; (g-i) 7T, T1-dominant; (j-l) 7T, T2-dominant. The fractional MR signals (Mz/M0) are displayed as functions of shot number (SN), TE and TR. Signals of gray matter (GM), white matter (WM) and blood are most suppressed (lines close to zero). The contrast is defined as (“CSF with Gd” – CSF).