Shubhangi Agarwal1, Emilie Decavel-Bueff1, Yung-Hua Wang1, Hecong Qin1, Romelyn Delos Santos1, Michael Evans1, and Renuka Sriram1
1Department of Radiology and Biomedical Imaging, University of California, San Francisco, San Francisco, CA, United States
1Department of Radiology and Biomedical Imaging, University of California, San Francisco, San Francisco, CA, United States
Multiparametric 1H MRI was able to report the stasis in tumor growth as compared to baseline as well as decrease in cellularity of kidney tumors in mice suffering from tuberous sclerosis (TSC) post everolimus treatment.
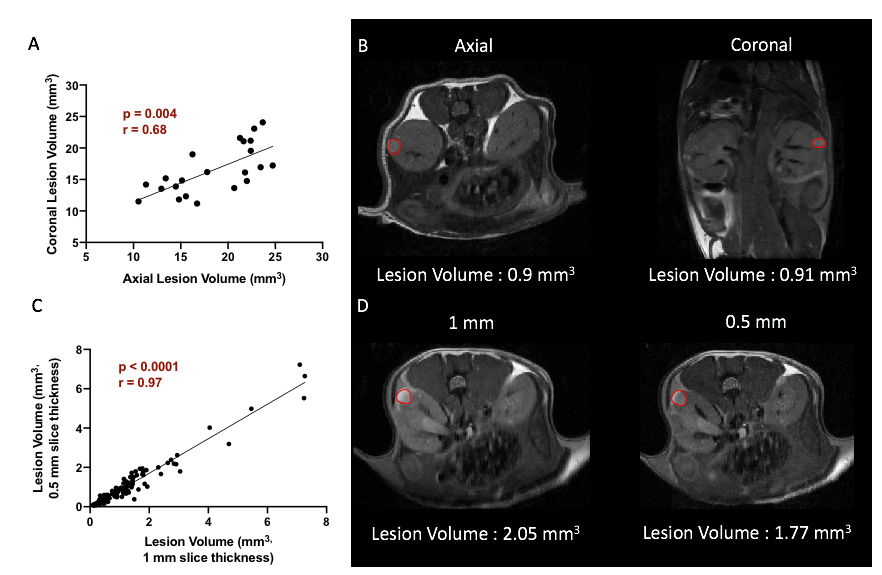
Figure 2: Comparison of axial vs coronal slice orientation and its effect on the tumor volume estimation (A). Representative T2-weighted axial and coronal images (B). Comparison of 1 mm vs 0.5 mm slice thickness and its effect on the tumor volume estimation (C). Representative T2-weighted 1mm and 0.5 mm slice thickness images (D).
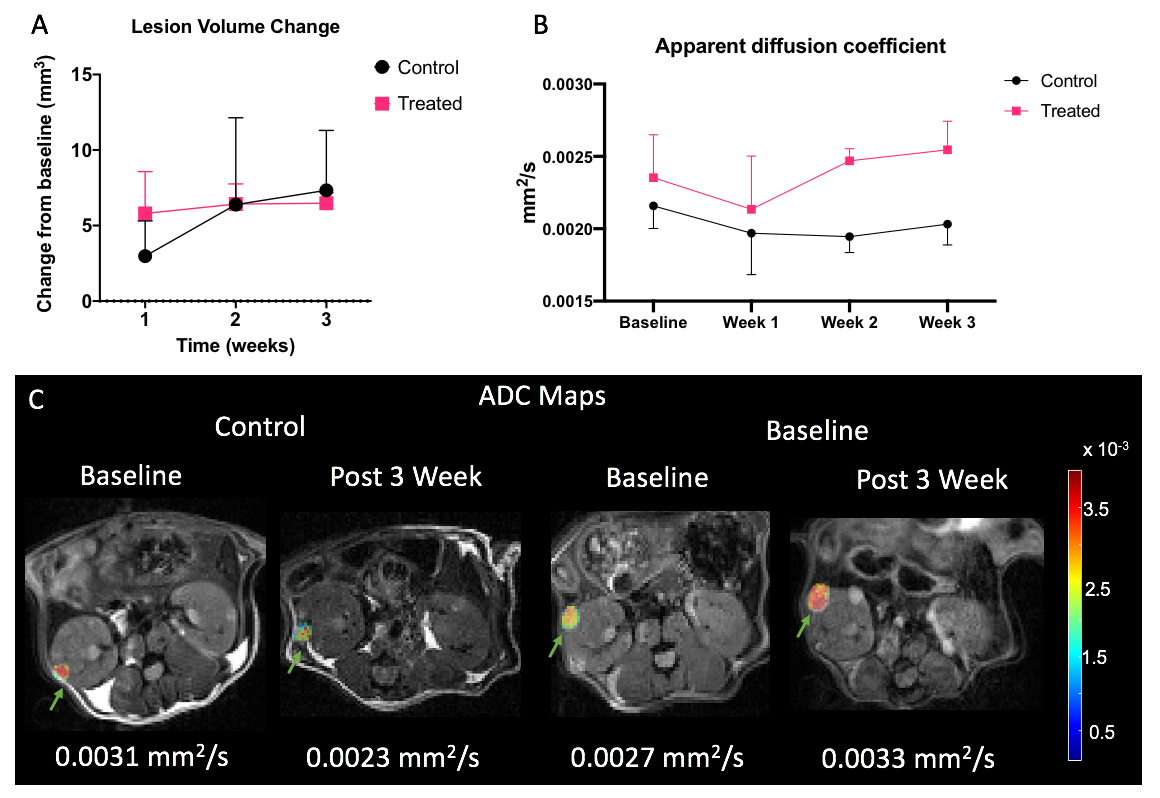
Figure 3: Lesion volume change with respect to baseline in control and treated mice (A). Mean ADC changes in control and treated mice over time (B). Representative ADC maps overlaid on diffusion weighted imaged at b = 25 s/mm2 at baseline and week 3 for control and treated tumors (C).