Kostiantyn Cherkas1, G. H. Im1, and S.G. Kim2
1Cener for Neuroscience Imaging Research (CNIR), Institute for Basic Science (IBS), Suwon 16419, Republic of Korea, Suwon, Korea, Republic of, 2Cener for Neuroscience Imaging Research (CNIR), Institute for Basic Science (IBS), Suwon 16419, Republic of Korea, Department of Biomedical Engineering, Sungkyunkwan University, Suwon, Korea, Suwon, Korea, Republic of
1Cener for Neuroscience Imaging Research (CNIR), Institute for Basic Science (IBS), Suwon 16419, Republic of Korea, Suwon, Korea, Republic of, 2Cener for Neuroscience Imaging Research (CNIR), Institute for Basic Science (IBS), Suwon 16419, Republic of Korea, Department of Biomedical Engineering, Sungkyunkwan University, Suwon, Korea, Suwon, Korea, Republic of
To investigate neural source of positive and negative BOLD signals, we modulated a balance of excitatory and inhibitory activity (EI) within the same somatosensory area to determine whether the polarity of evoked BOLD response is reversed.
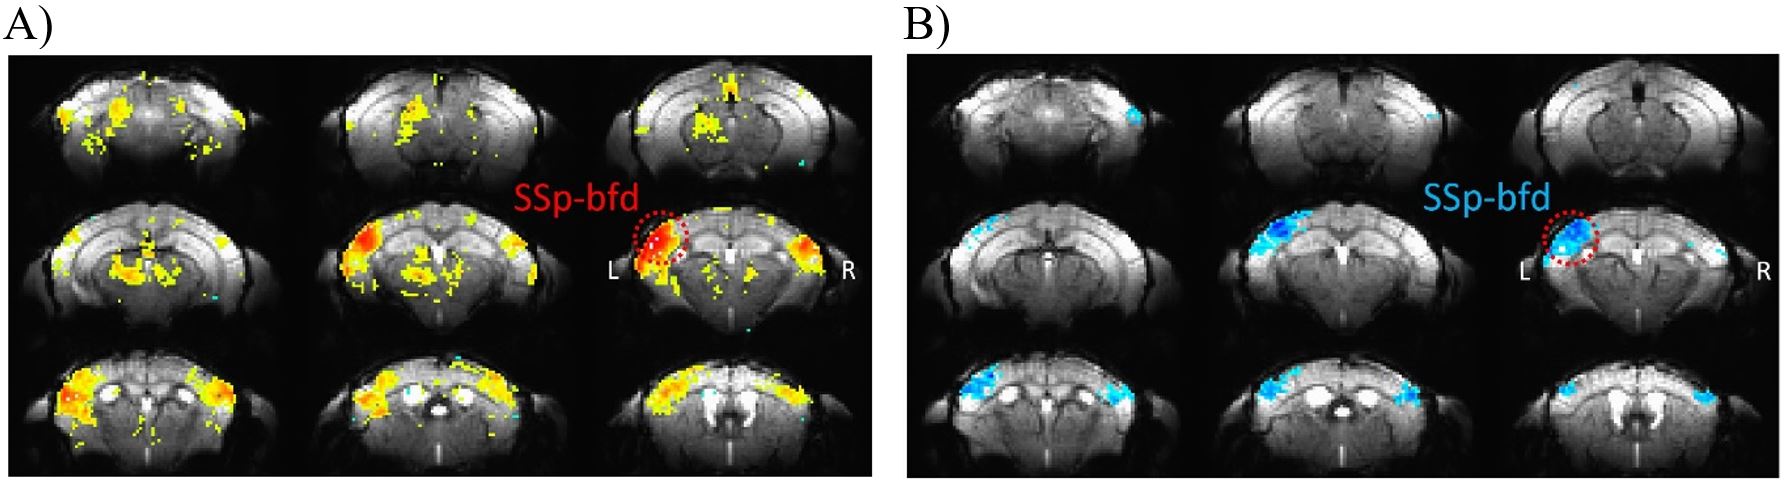
Figure 1. Evoked functional changes to a set of 2 different stimulation frequencies. Main response area is marked with red circle and located in primary somatosensory area, barrel field (SSp-bfd).
A) Areas in the mice brain show positive functional changes to 4 Hz stimulation frequency.
B) Areas in the mice brain show negative functional changes to 20 Hz stimulation frequency.
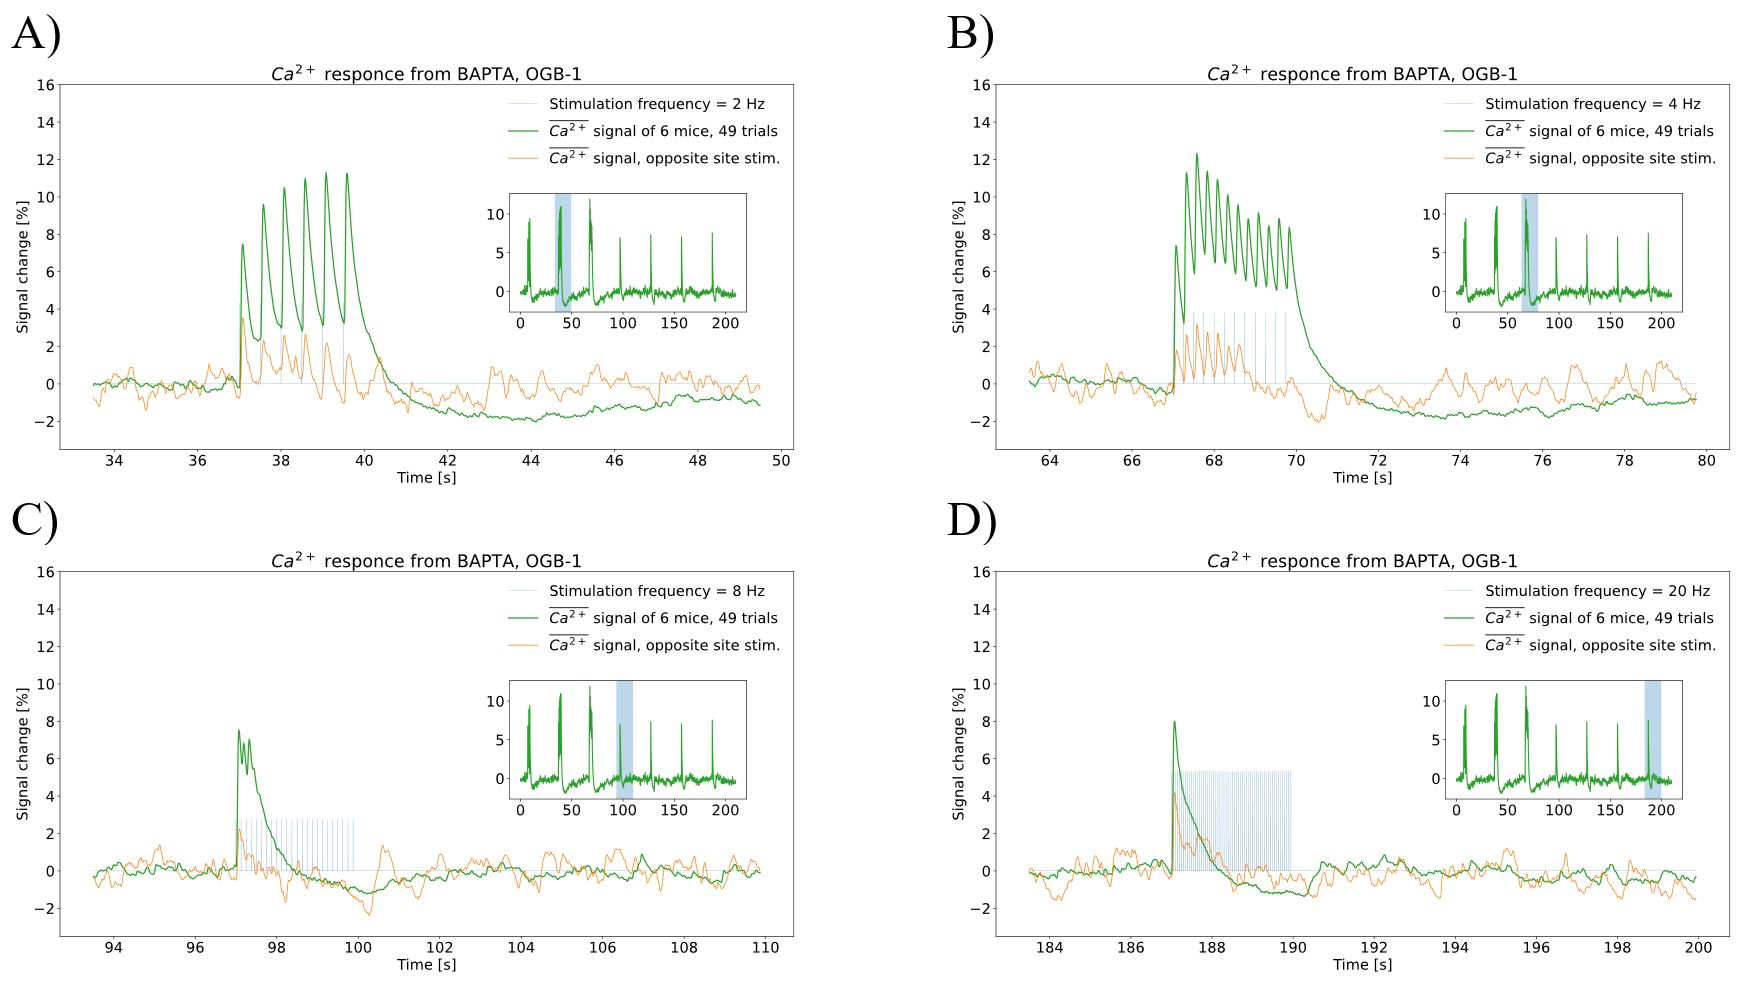
Figure 3. Measured
local calcium response. Trace displayed is the signal average within 6 mice. Subfigures A),
B), C), D), refer to measured calcium signal response at respectively 2, 4, 8
and 20 Hz of stimulation frequency. Inset figure represents continuous
calcium trace of all 7 different stimulation frequencies, blue solid shadowed
area captures relative position of the main figure signal within stimulation
trial. Units of axis on inset and main figures are same. Yellow line on the main figure denotes signal
from same experimental condition but opposite whisker
pad stimulation.