Codi Gharagouzloo1, Praveen Kulkarni2, Joshua Leaston1, Kevin Johnson3, Jonathan Polimeni4, Ju Qiao5, Misung Han6, Peder Larson6, and Craig Ferris2
1Imaginostics, Inc., Cambridge, MA, United States, 2Center for Translational Neuroimaging, Northeastern University, Boston, MA, United States, 3Medical Physics, University of Wisconsin–School of Medicine and Public Health, Madison, WI, United States, 4Martinos Center, Massachusetts General Hospital and Athinoula A. Martinos Center for Biomedical Imaging, Boston, MA, United States, 5Massachusetts General Hospital, Boston, MA, United States, 6University of California, San Francisco, San Francisco, CA, United States
1Imaginostics, Inc., Cambridge, MA, United States, 2Center for Translational Neuroimaging, Northeastern University, Boston, MA, United States, 3Medical Physics, University of Wisconsin–School of Medicine and Public Health, Madison, WI, United States, 4Martinos Center, Massachusetts General Hospital and Athinoula A. Martinos Center for Biomedical Imaging, Boston, MA, United States, 5Massachusetts General Hospital, Boston, MA, United States, 6University of California, San Francisco, San Francisco, CA, United States
QUTE-CE MRI biomarkers detect early preclinical small vessel disease in ApoE4 rats, BBB leakage in rmTBI with sensitivity to single animals and hits, and is feasible in human neuroimaging.
(a)
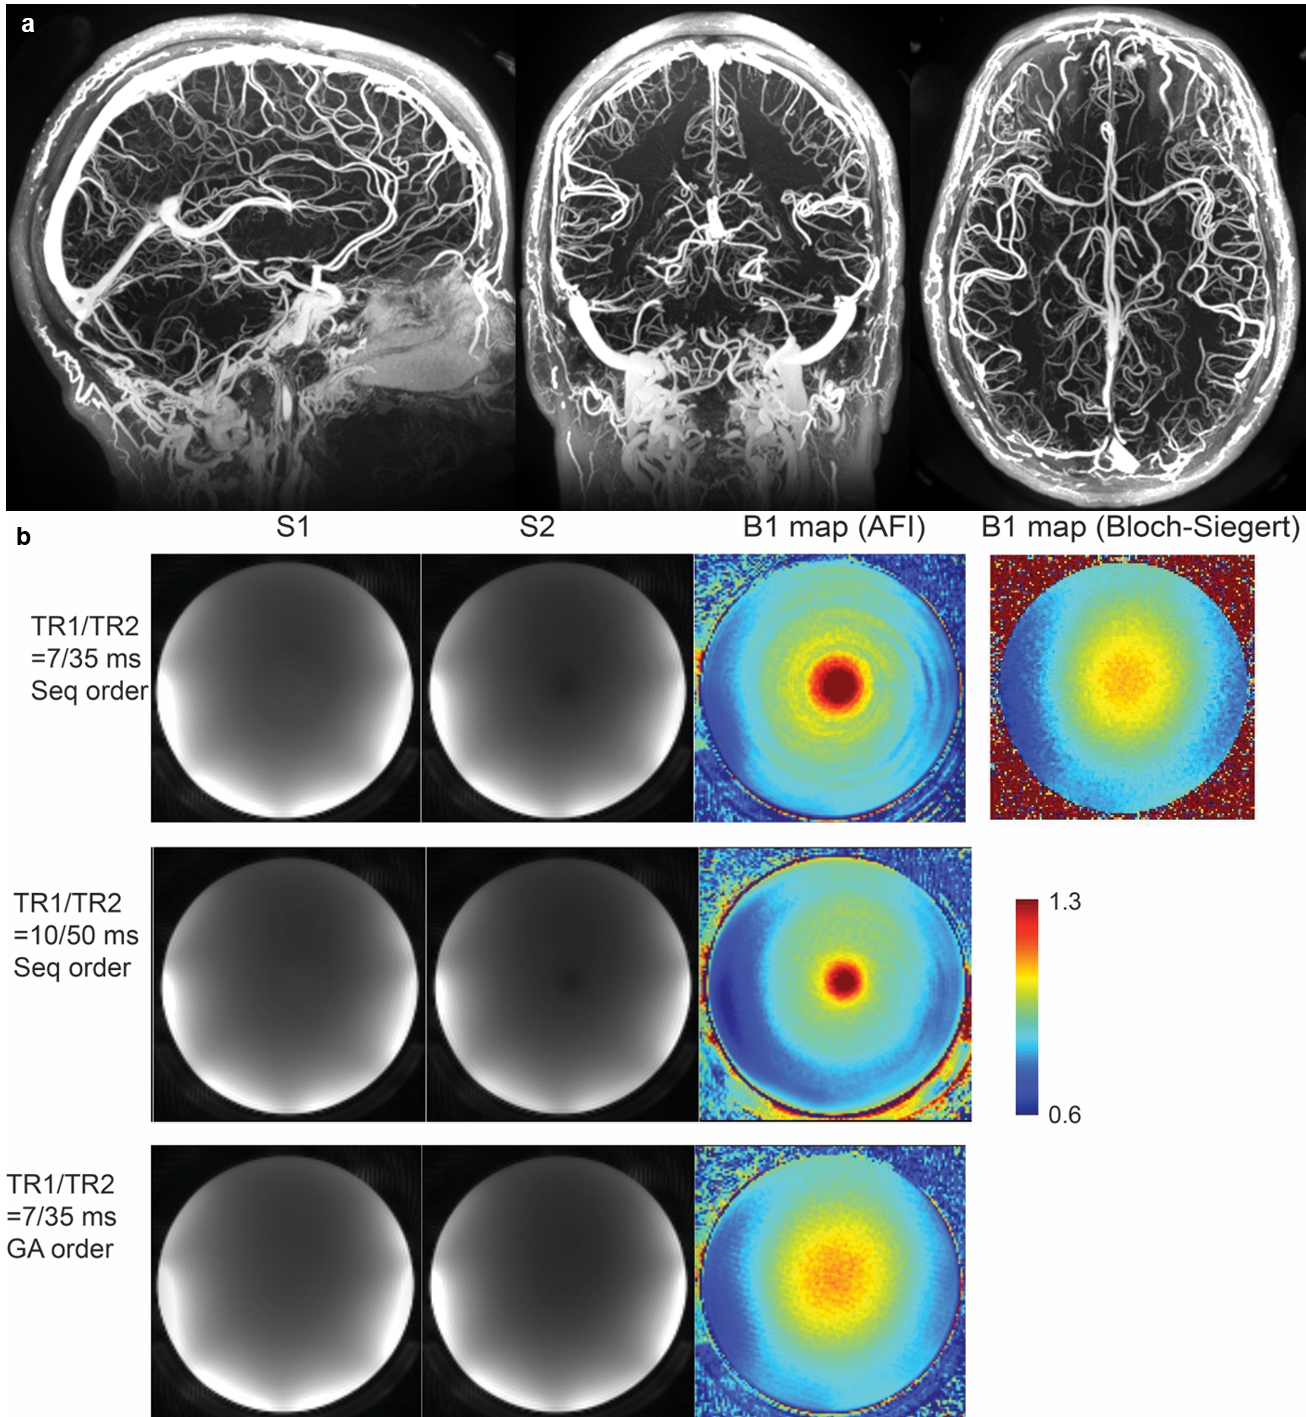
QUTE-CE MRI Angiographic Quality at 3T. Imaging
parameters were:
TR=4ms, TE=0.1, Flip=20°, 0.4mm isotropic, 6:40 scan time, (b)
Images from Cones-AFI and Resultant B1+ maps. The top two rows are from
sequential ordering, with higher spoiler gradient areas for the second row.
Some residual transverse magnetization affects a signal level in the center of FoV,
resulting high B1+ values. The bottom row images are from golden-angle
ordering, and the resultant B1+ map is really similar
to
Bloch-Siegert B1+
map.
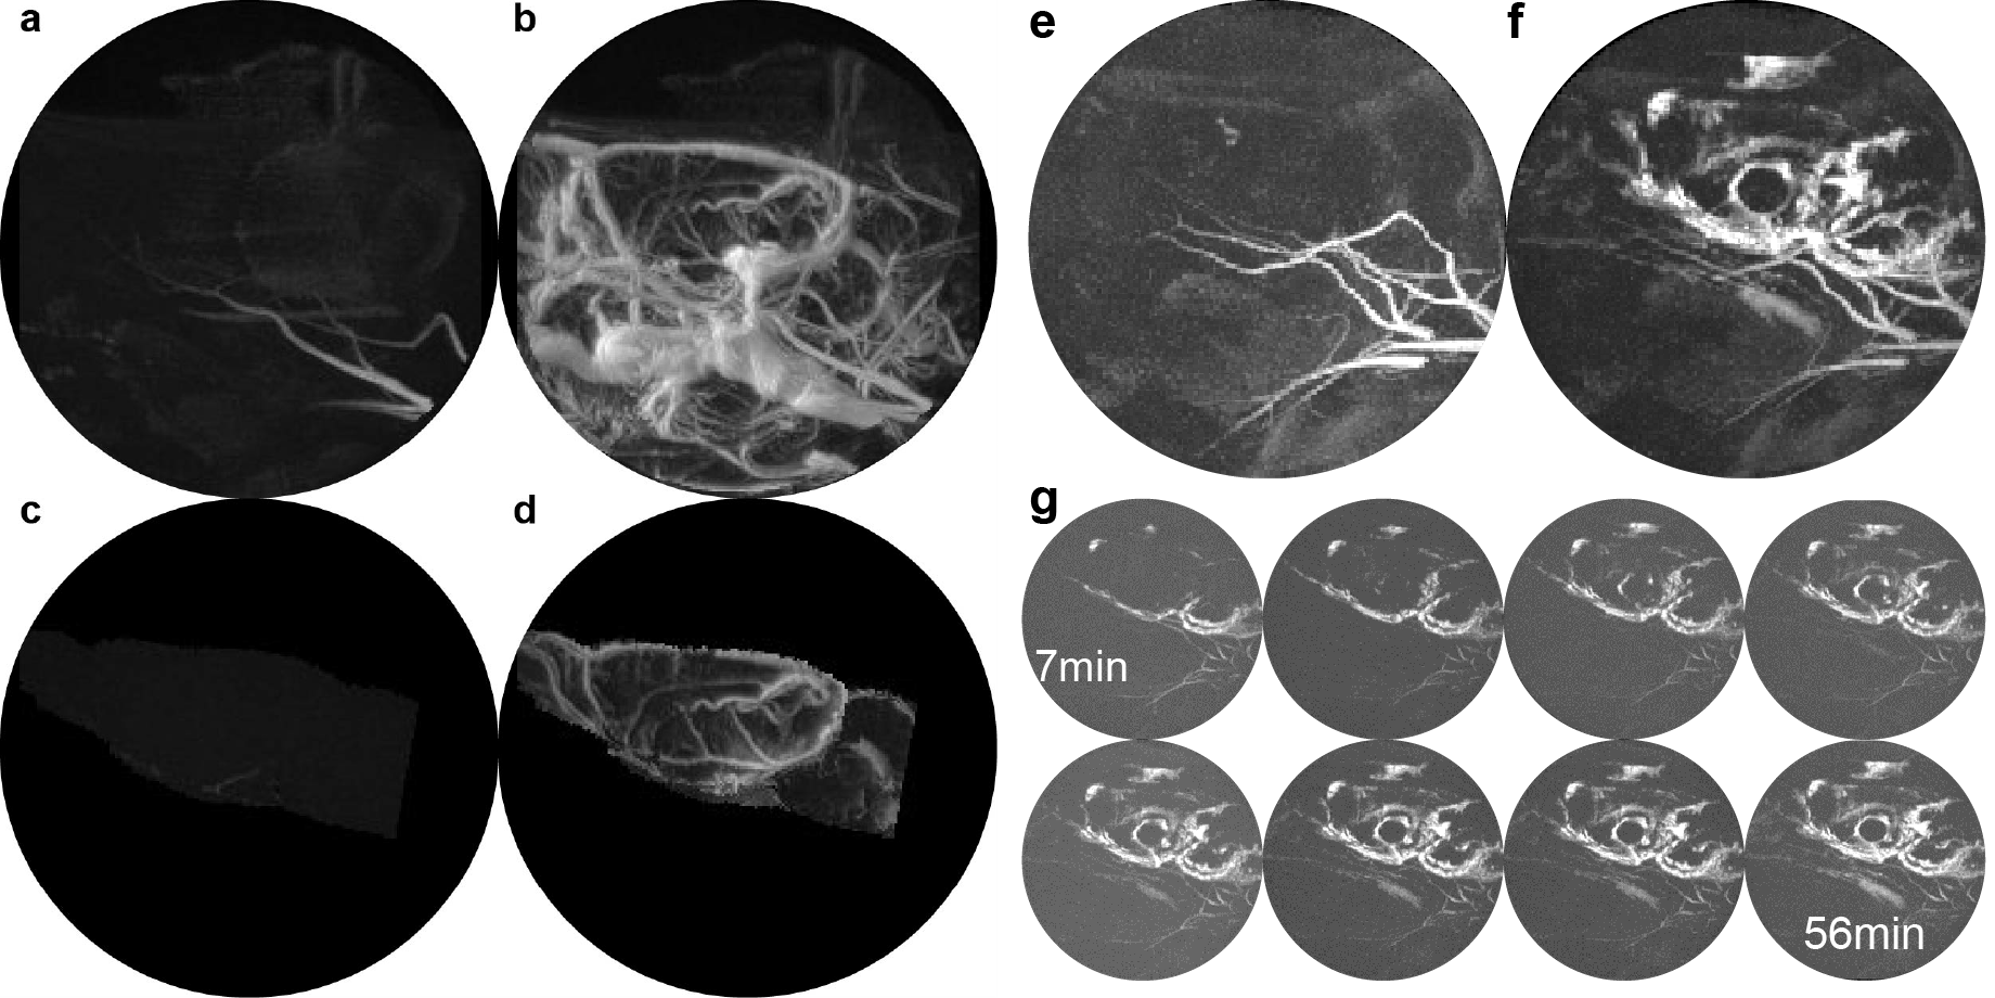
Maximum intensity projection images (MIPs) of the whole rat
head at 8 months are displayed (a) pre-contrast and (b) post-contrast 14mg/kg
ferumoxytol. Unique contrast-enhanced vascular MIPs are obtained and (c,d) the
brain is segmented .
(c) pre- and (d) post-contrast
images
demonstrates
that the
time-of-flight signal
enhancement
is limited to the arteries at the periphery of the FoV.
(e-g) MIPs of a rat head after intrathecal injection demonstrate glymphatic (e)
pre-contrast (f) after 56 minutes. (g) The dynamic mixing is visualized from
7-56min in subtraction images.