Sophia Kronthaler1, Christof Boehm1, Kilian Weiss2, Marcus R. Makowski1, and Dimitrios C. Karampinos1
1Department of Diagnostic and Interventional Radiology, School of Medicine, Technical University of Munich, Munich, Germany, 2Philips Healthcare, Hamburg, Germany
1Department of Diagnostic and Interventional Radiology, School of Medicine, Technical University of Munich, Munich, Germany, 2Philips Healthcare, Hamburg, Germany
The static dephasing regime should be considered when setting the minimum TE in R2* and PDFF mapping of bone marrow using chemical shift encoding-based water-fat separation methods. The static dephasing regime induces a bias in R2* and PDFF maps of bone marrow in regions with high bone density.
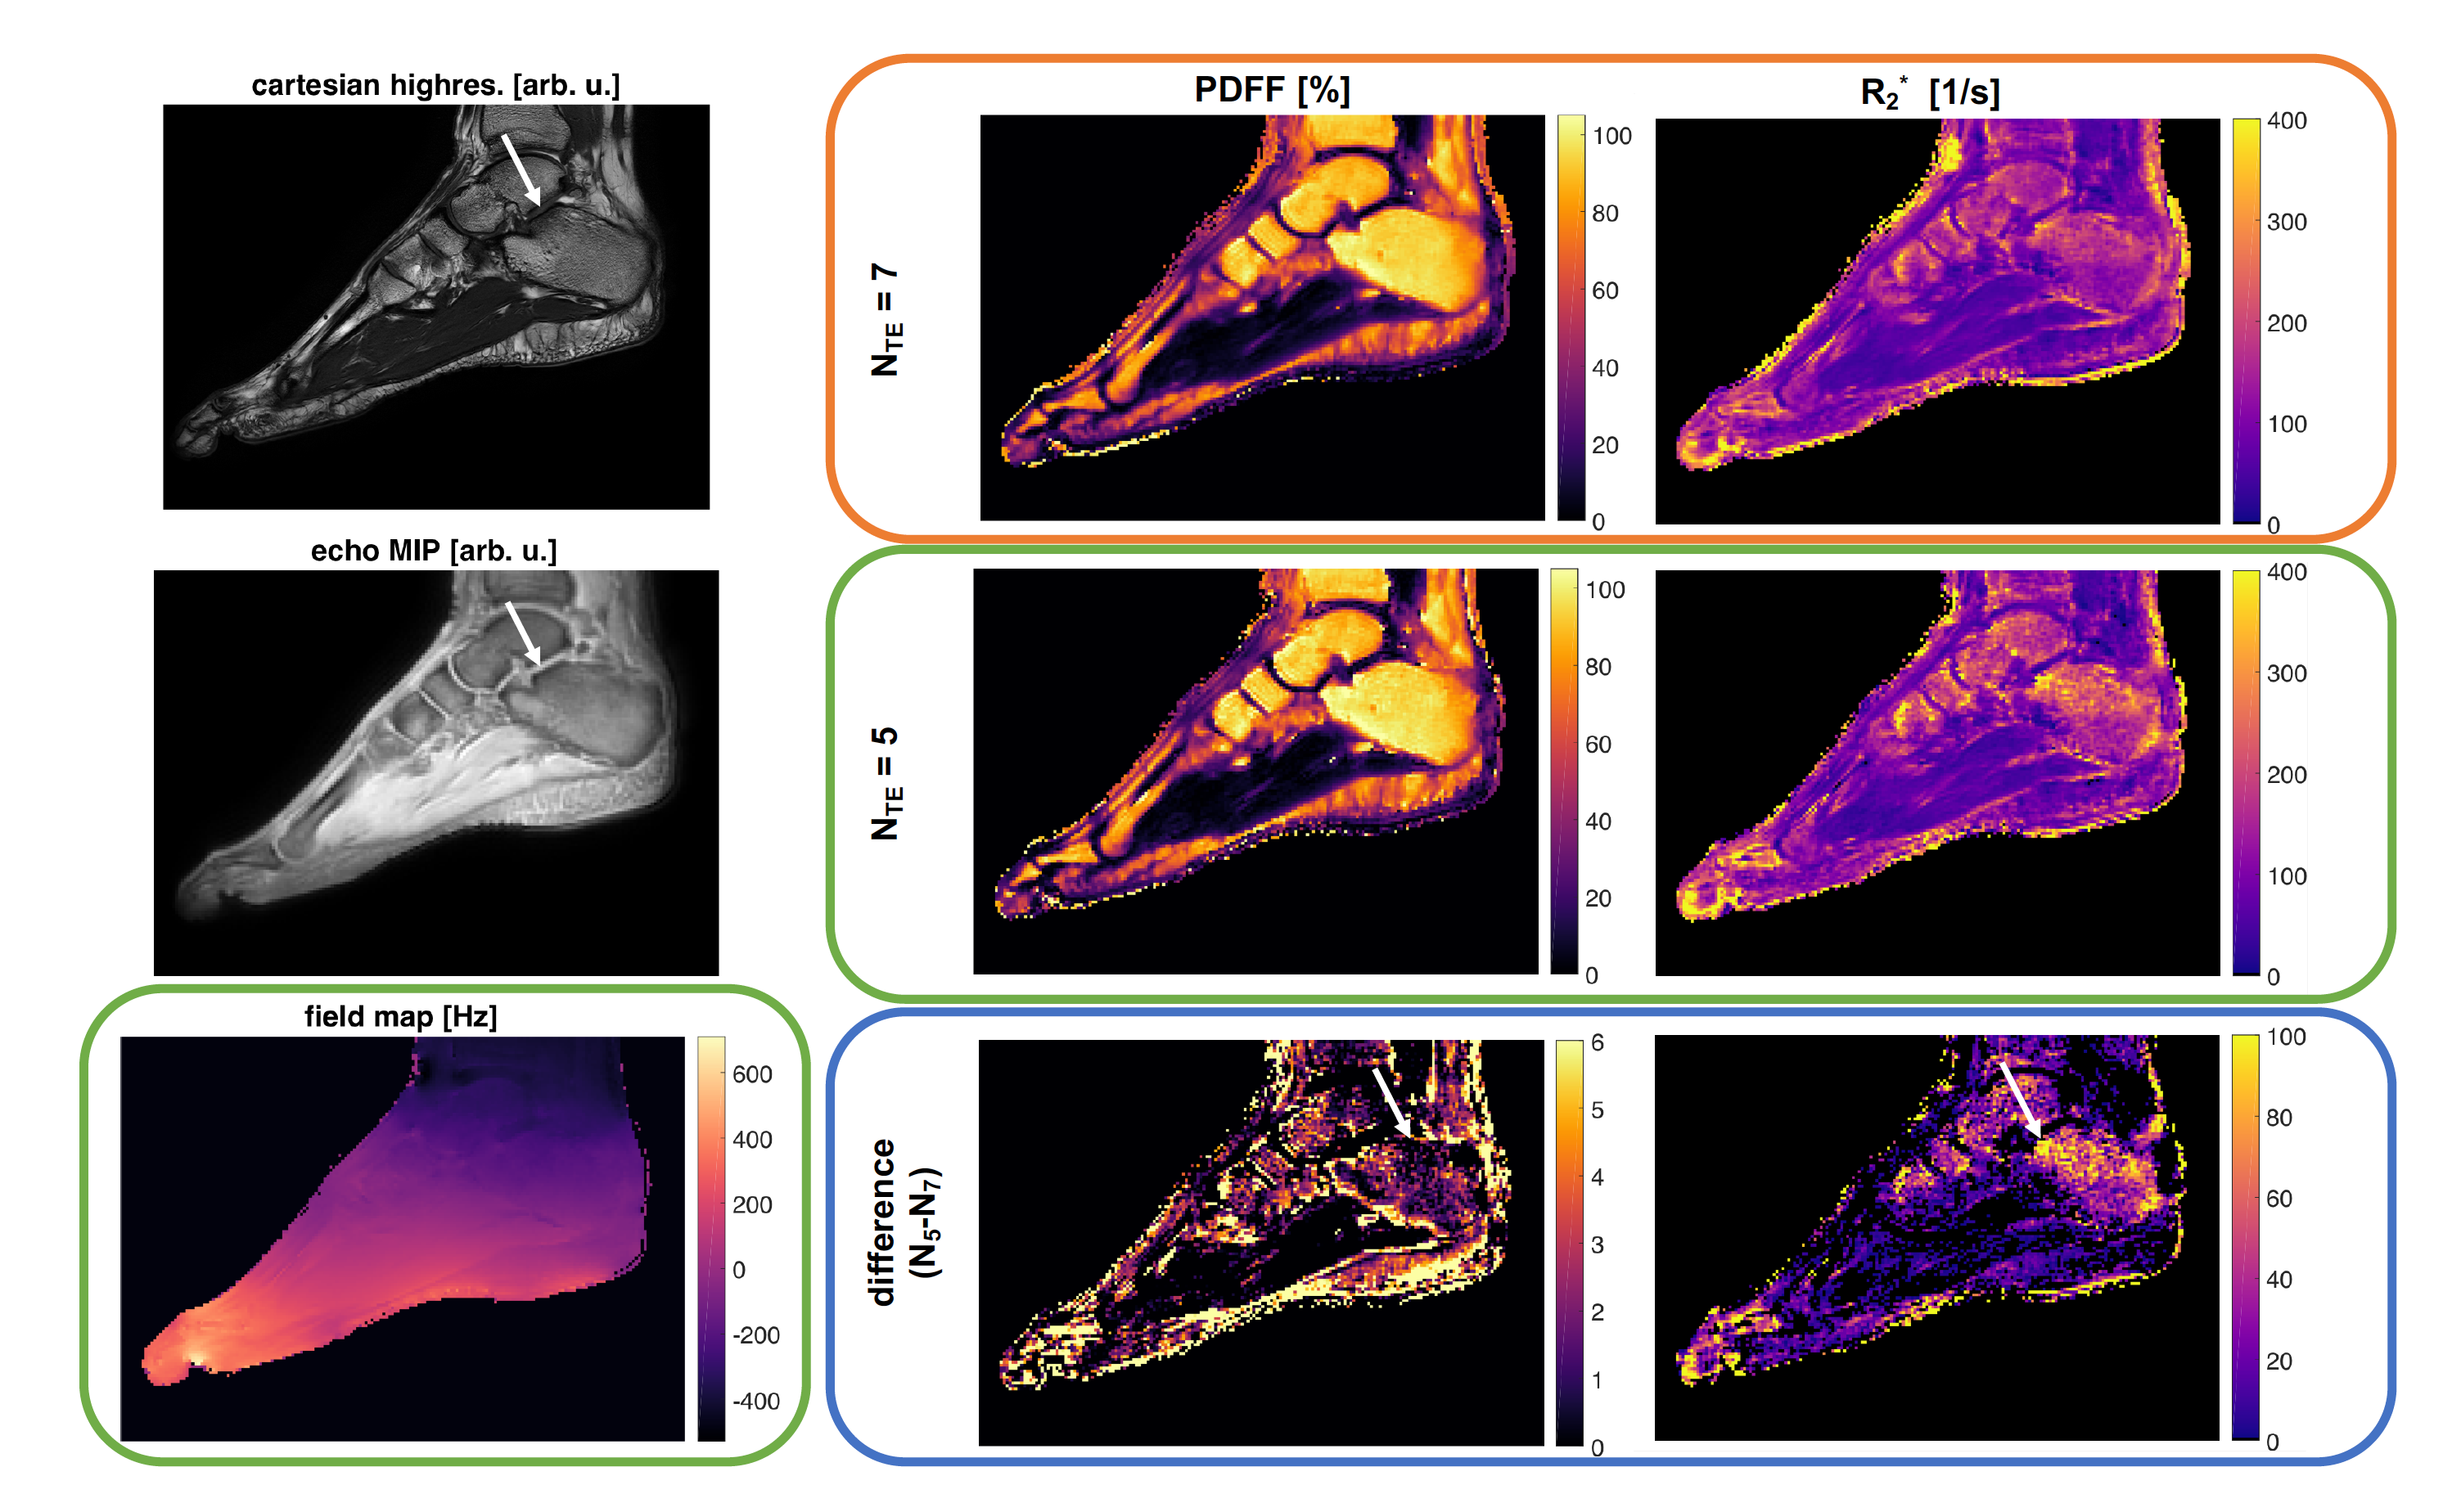
Figure 2: Upper left shows a Cartesian high resolution bFFE scan of the ankle in a healthy volunteer to visualize trabecularization of the bone. The remaining images originate from a 3D UTE stack-of-stars acquisition (middle left) processed with all available 7 TEs (orange block) and with the later 5 TEs (green block). In both cases the field map obtained from the 5TEs (lower left) was used for the initialization. The difference maps (blue block) showed higher PDFF and higher R2* values for regions with higher bone densities (indicated with white arrow).
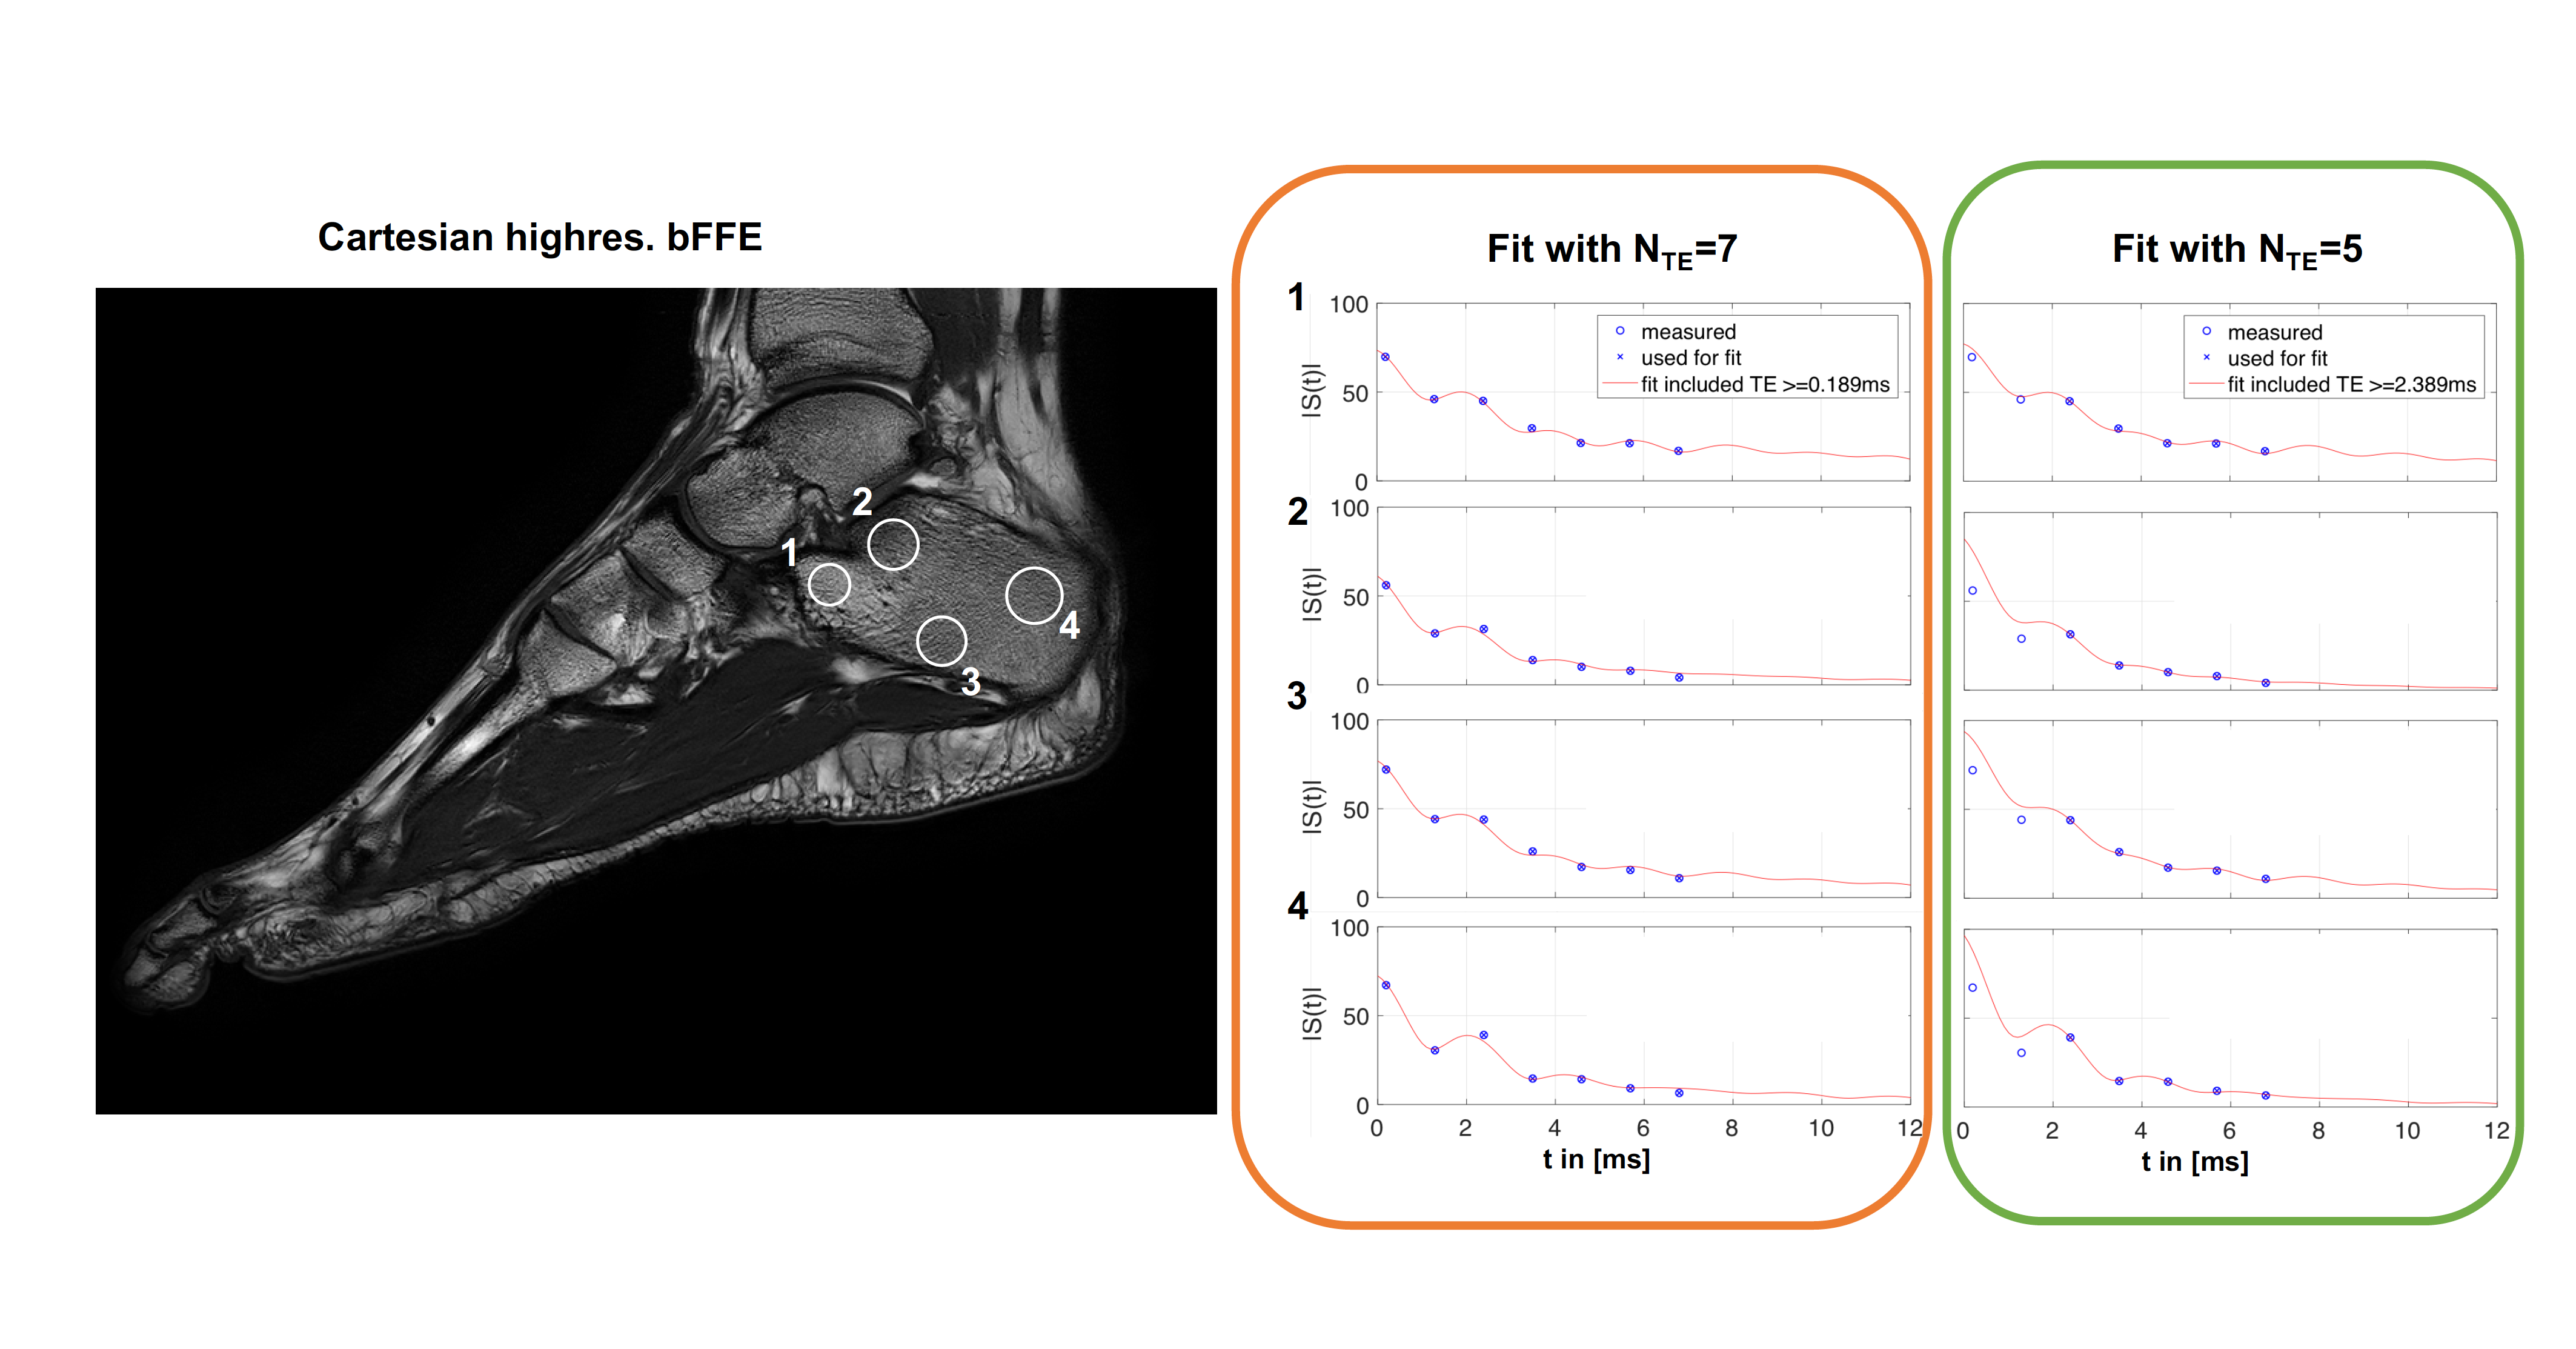
Figure 3: Signal decay for selected regions of the calcaneus (left). Middle column (red) shows the signal fitted with all TEs, the right column shows the fitting with the later 5 TEs (green). The cavum calcanei (ROI 1) has a high fat content16 and minor differences using different TE regimes were visible. In regions with high trabecularization (T12, L2) signal deviations at the first TE compared to the fitted curve based on later TEs were observed. In the tuber calcanei (ROI 3-4), characterized by lower fat content but also less trabecularized bone, the signal deviation was still visible.