Michael B Scott1, Haben Berhane1, Justin Baraboo1, Cynthia K Rigsby2, Joshua D Robinson2, Patrick M McCarthy1, S Chris Malaisrie1, Ryan J Avery1, Bradley D Allen1, Alexander Barker3, and Michael Markl1
1Northwestern University, Chicago, IL, United States, 2Lurie Children's Hospital of Chicago, Chicago, IL, United States, 3University of Colorado, Anschutz Medical Campus, Aurora, CO, United States
1Northwestern University, Chicago, IL, United States, 2Lurie Children's Hospital of Chicago, Chicago, IL, United States, 3University of Colorado, Anschutz Medical Campus, Aurora, CO, United States
An automated CNN-based pipeline demonstrated in more than 2000 datasets can automatically preprocess, segment, and analyze aortic 4D flow MRI.
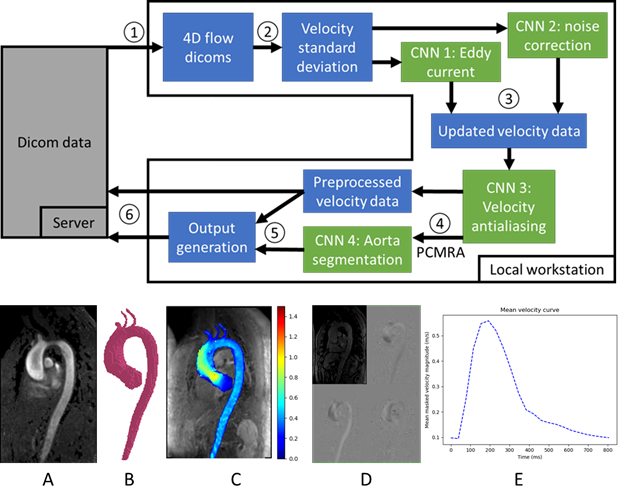
Figure 1: Top: Pipeline. 1. 4D flow data is pulled from server 2. Dicoms are loaded and the velocity standard deviation is input into the eddy current and noise masking CNNs. 3. Velocity data is fed into the antialiasing CNN. 4. Phase contrast MR angiogram (PCMRA) is calculated and input into the segmentation CNN. 5. Outputs are generated. 6. Results pushed back to the server. Bottom: example outputs. A: PCMRA, B: segmentation preview, C: velocity MIP, D: data preview, E: mean velocity flow curve.
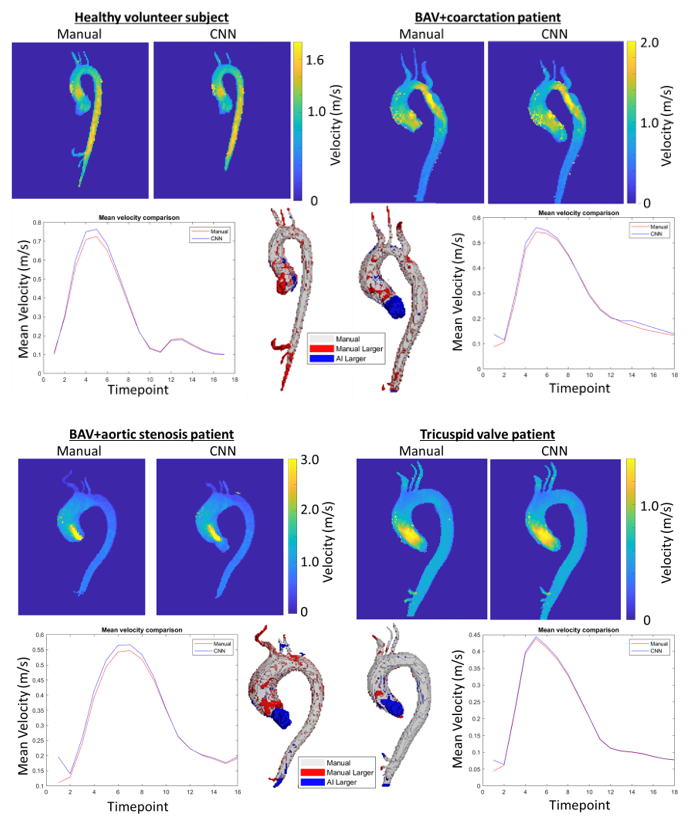
Figure 2: Example outputs. Top left: healthy subject, Top right: bicuspid aortic valve (BAV) and coarctation patient. Bottom left: BAV and stenosis patient, Bottom right: tricuspid valve patient. For each patient, peak systolic velocity maximum intensity projections for manual workflow (left) and CNN pipeline (right) are shown, as well as mean velocity curves for manual (red) and CNN (blue). In the 3D mask comparison, grey is shared, red volumes are larger in the manual, and blue volumes are larger in the CNN.