Jackie Yik1,2, Pierre Becquart3, Jasmine Gill3, Shannon H. Kolind1,2,4,5, Virginia Devonshire5, Ana-Luiza Sayao5, Alice Schabas5, Robert Carruthers5, Anthony Traboulsee5, G.R. Wayne Moore2,3, David K.B. Li4,5, Sophie Stukas3, Cheryl Wellington3, Jacqueline A. Quandt3, Irene M. Vavasour2,4, and Cornelia Laule1,2,3,4
1Physics and Astronomy, University of British Columbia, Vancouver, BC, Canada, 2International Collaboration on Repair Discoveries, Vancouver, BC, Canada, 3Pathology and Laboratory Medicine, University of British Columbia, Vancouver, BC, Canada, 4Radiology, University of British Columbia, Vancouver, BC, Canada, 5Medicine, University of British Columbia, Vancouver, BC, Canada
1Physics and Astronomy, University of British Columbia, Vancouver, BC, Canada, 2International Collaboration on Repair Discoveries, Vancouver, BC, Canada, 3Pathology and Laboratory Medicine, University of British Columbia, Vancouver, BC, Canada, 4Radiology, University of British Columbia, Vancouver, BC, Canada, 5Medicine, University of British Columbia, Vancouver, BC, Canada
Multiple sclerosis serum neurofilament light chain levels correlated with myelin water fraction, axial and radial diffusivity, and fractional anisotropy in whole brain and normal appearing white matter but only with myelin water fraction in lesions.
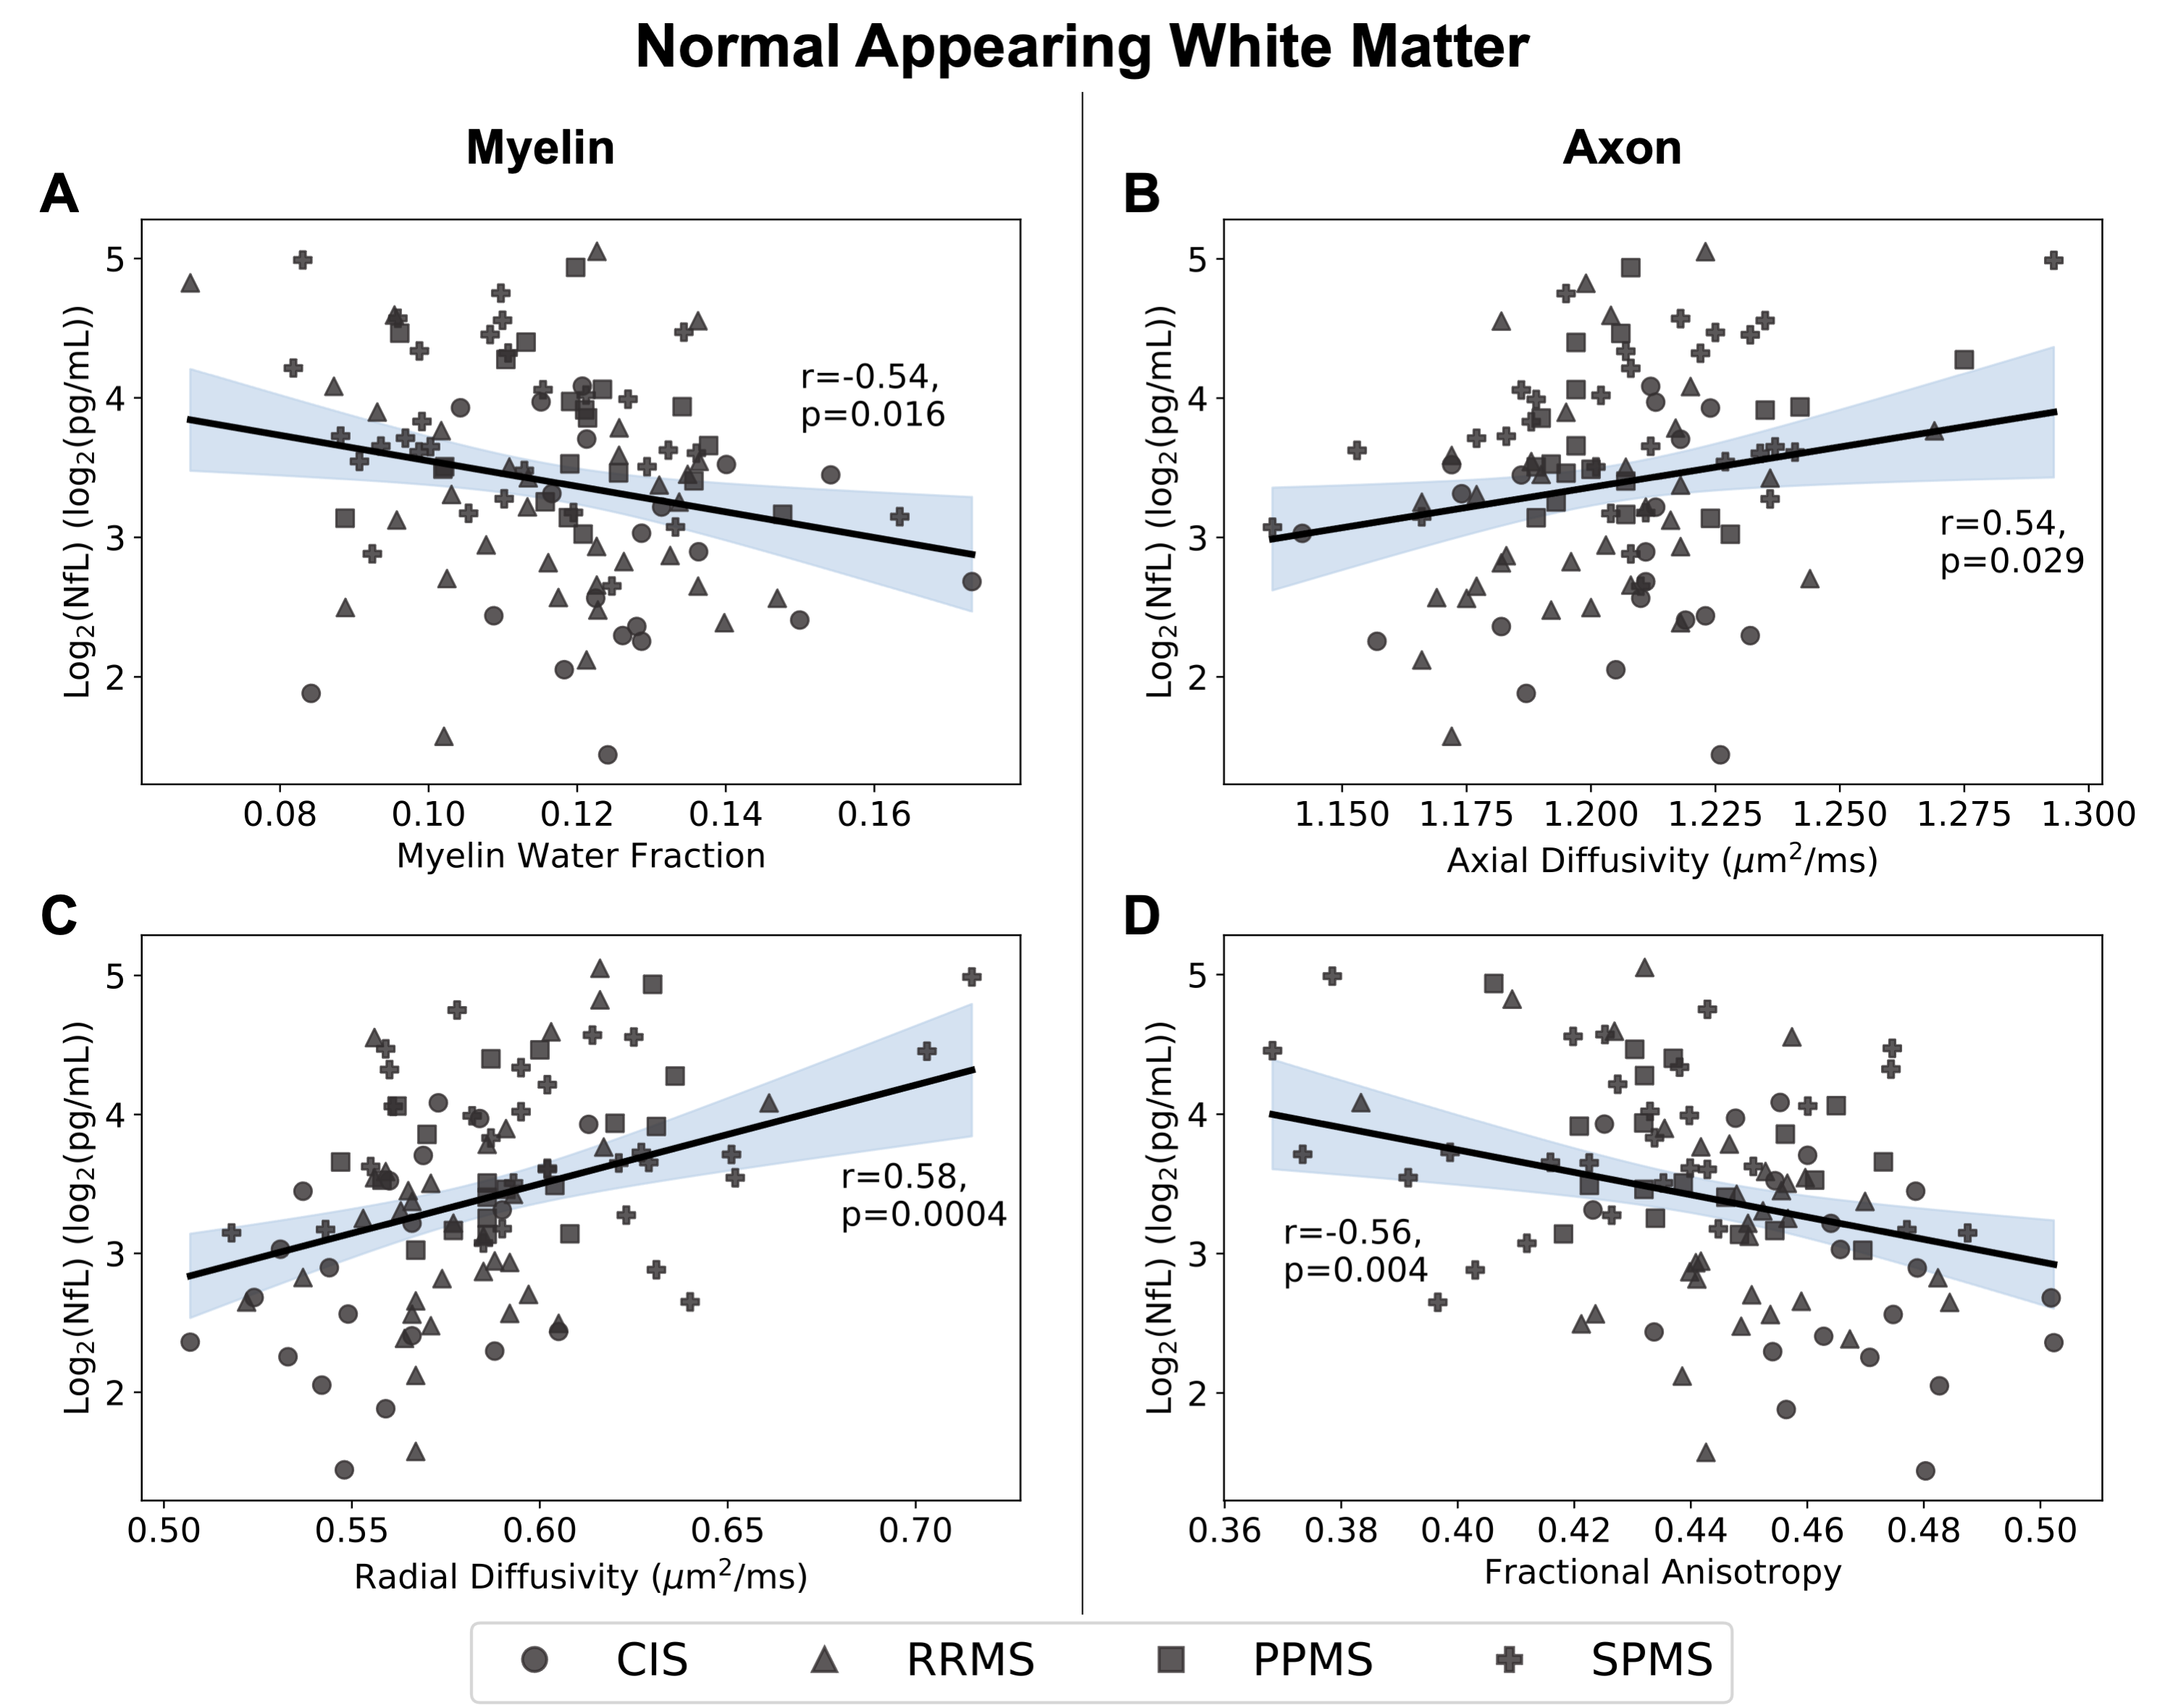
Regression plots for the normal appearing white matter region showing the relationship between logarithmically transformed serum neurofilament light (NfL) chain and measures for myelin content (myelin water fraction (A) r=-0.54, p=0.016; radial diffusivity (C) r=0.58, p=0.0004) or axon integrity (axial diffusivity (B) r=0.54, p=0.029; fractional anisotropy (D) r=-0.56, p=0.004). 95% confidence interval is shaded.
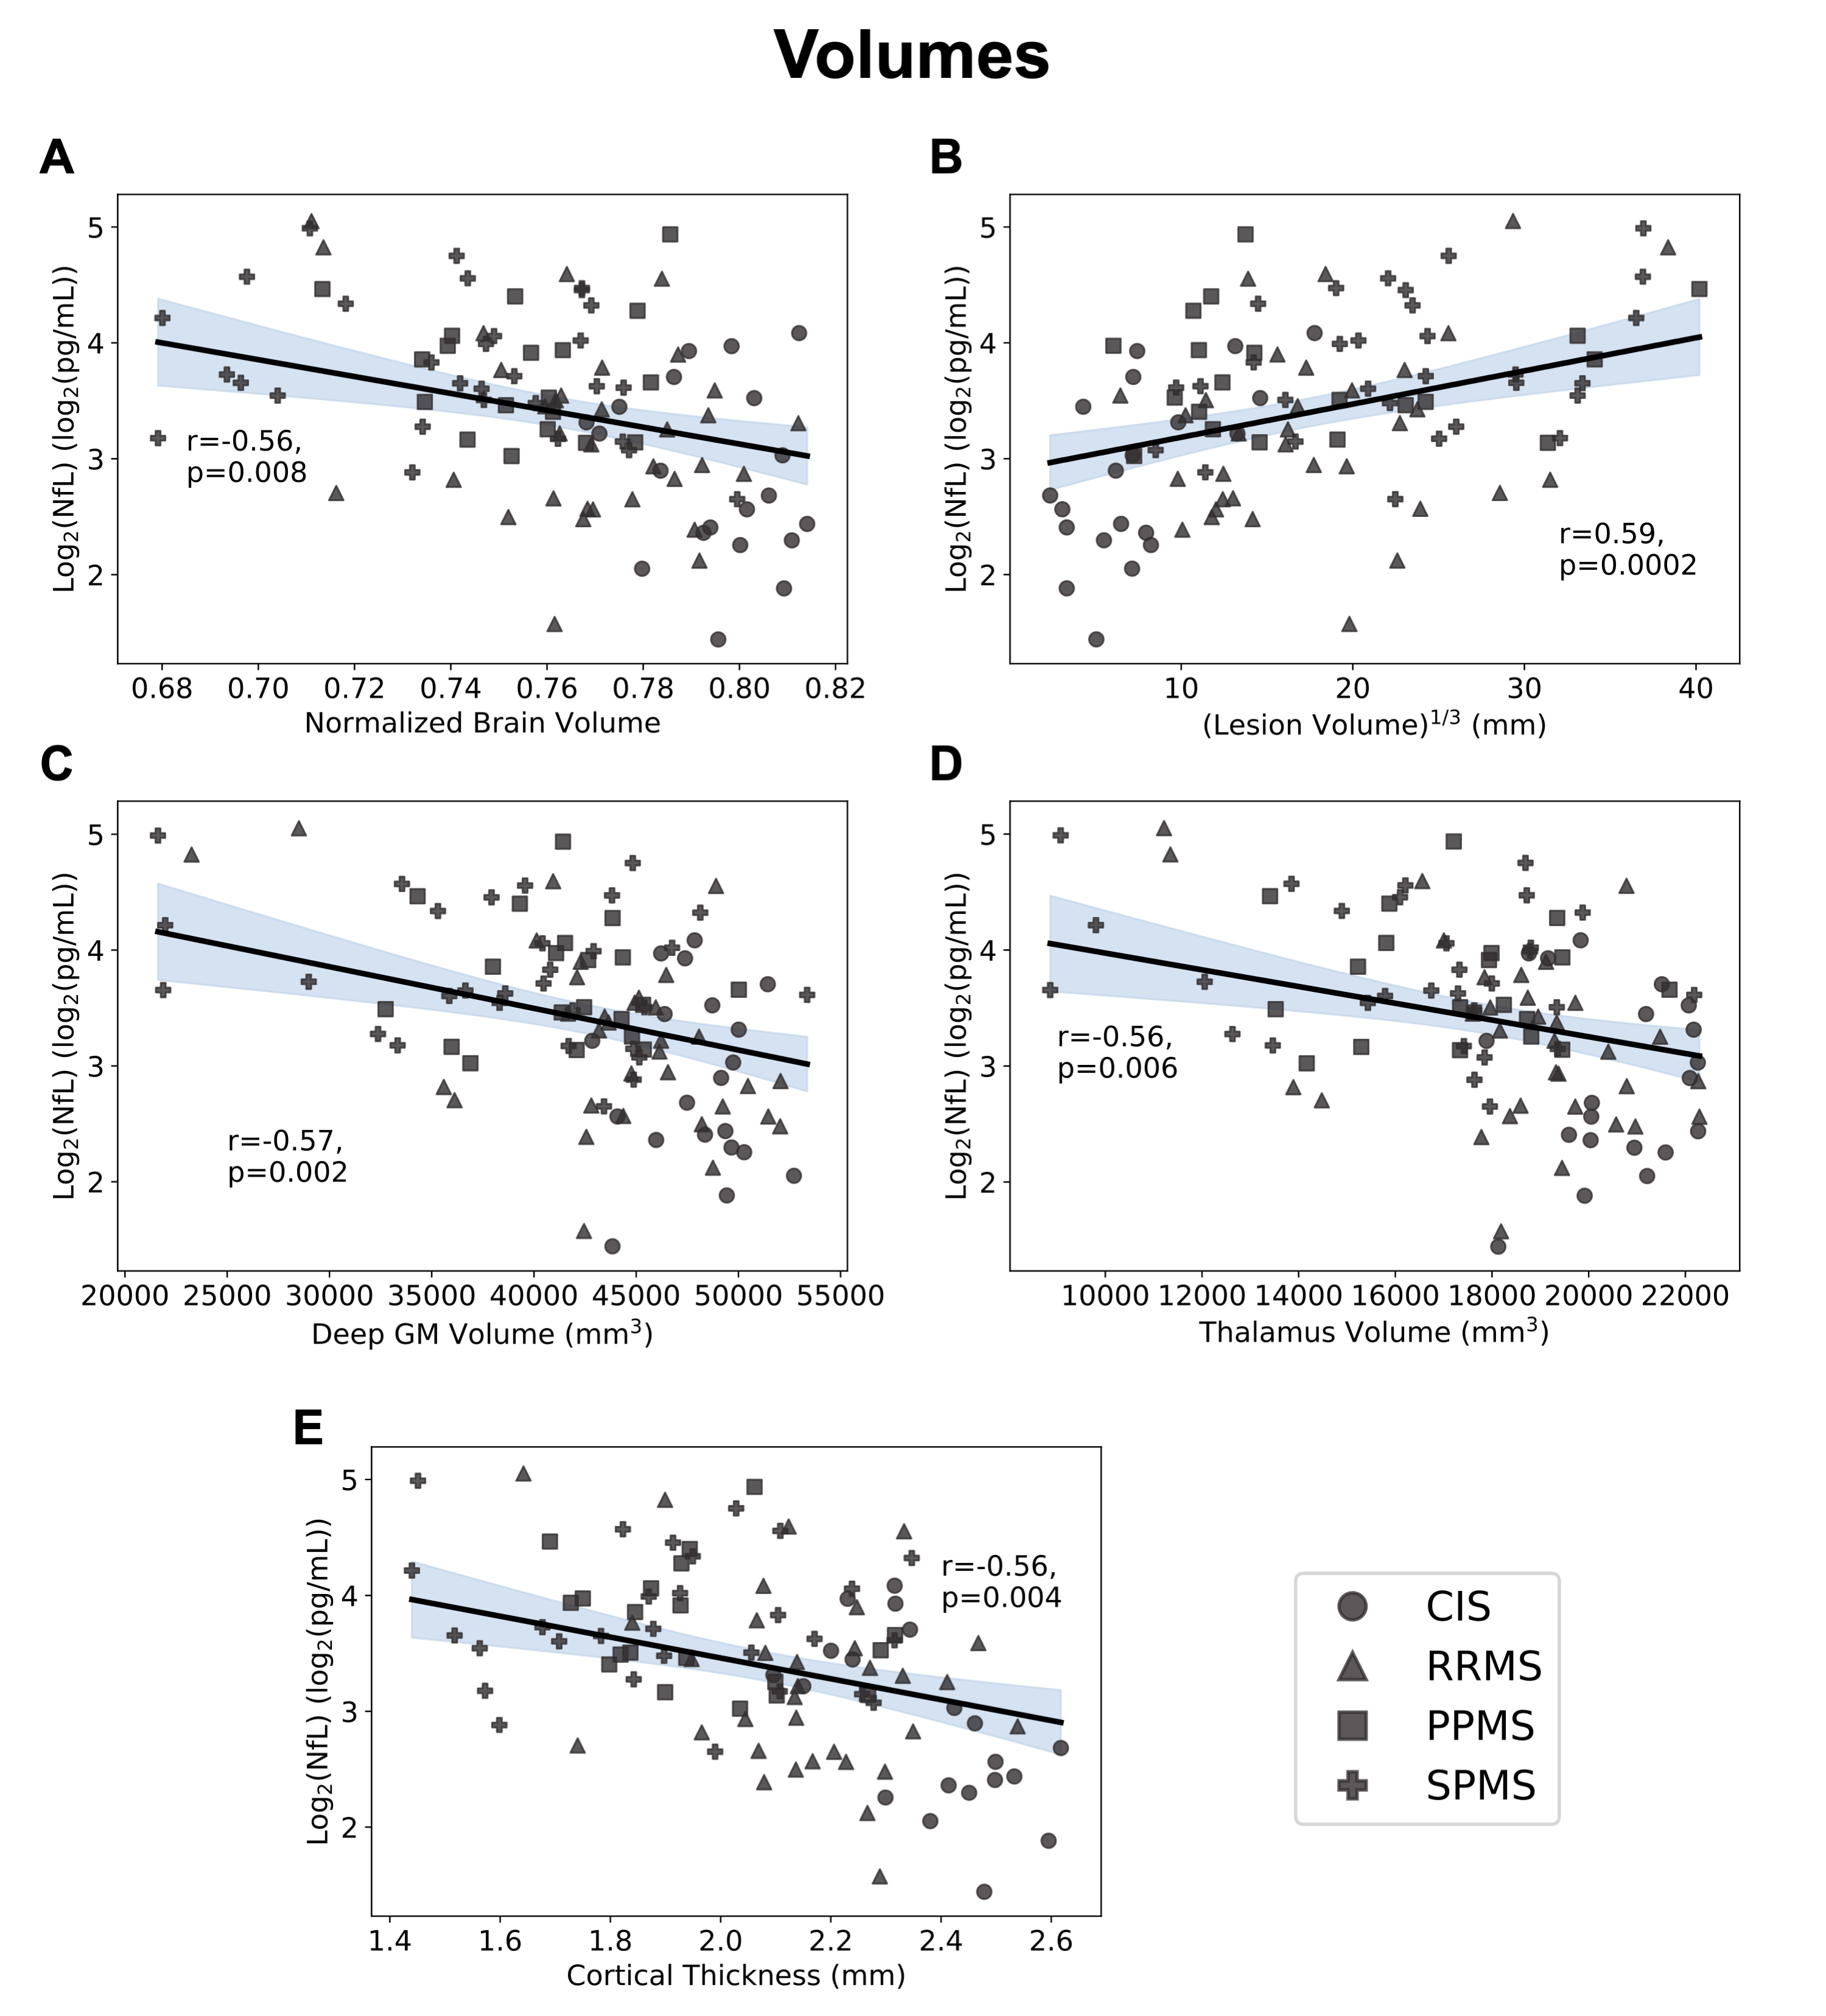
Regression plots for the relationship between logarithmically transformed serum neurofilament light chain (NfL) and volumetric imaging measures (normalized brain volume (A) r=-0.56, p=0.008; cube root lesion volume (B) r=0.59, p=0.0002; deep grey matter volume (C) r=-0.57, p=0.002; thalamus volume (D) r=-0.56, p=0.006; cortical thickness (E) r=-0.56, p=0.004). 95% confidence interval is shaded.